7 Best Survey Software with Data Analysis Tools in 2026

Most survey platforms promise powerful built-in data analysis tools, but often fall short when it comes time to actually work with your results. In order to filter data, compare variables, or build the exact charts you need, you have to export everything to Excel or another tool, which is painful and time-consuming.
The best market research survey software lets you do all of this from one platform — saving you time and money on extra tools. With these platforms, you can:
- Slice and dice data with just a few clicks
- Filter results to see exactly what you need
- Build custom charts with multiple variables
- Run statistical significance tests
- Add your own branding to visualizations
In this article, we’ll explore the top survey software with built-in data analysis tools, starting with our own platform, Pollfish. We’ll also look at other leading options so you can choose the right tool for your goals.
Best Survey Software with Data Analysis Tools
1. Pollfish

Pollfish, our DIY survey software, offers powerful built-in data analysis features through an easy-to-use interface.
Customer reviews on Trustpilot consistently point out the ability to easily filter and segment survey results as a standout feature:
“Got my results back and WOW. The ability to cut data is phenomenal. What seems like clear answers from the market research can easily be stress tested by the ease of data analysis.”
“The results data was easy to navigate. I particularly liked the include/exclude filtering options and ability to simply click on a value to isolate those specific results.”
“We got exactly what we needed and were able to slice the data in so many effective ways. Great reporting. Highly recommend”
“The results come quickly and can be downloaded in different formats and with different filters. What we like most is the ability to filter the results and analyze them separately for each segment. We highly recommend this platform.”
– Read the full review here
“The results dashboard is just great. You can filter responses and view them in different ways depending on how you want to use and analyze the data.”
Up next, we’ll discuss:
- Pollfish’s key data analysis capabilities, including:
- Multiple ways to view your survey results, including table format, color-coded column or pie charts, and more.
- Demographic and subgroup filtering to isolate and display survey responses from specific populations only.
- Response-based filtering to show only survey data from respondents who gave particular answers to certain questions.
- Insights Builder for advanced data manipulation and analysis, including the ability to create sophisticated multi-variable charts via simple drag and drop functionality.
- Custom branding options to personalize visuals and reports with your company logos, colors, and styling.
- Statistical significance testing that can be applied to any chart in just a few clicks.
- Flexible export options to PDF, Excel, Crosstabs, or SPSS.
- Other notable advantages of Pollfish’s survey software:
- Rigorous audience data quality measures, ensuring reliable data.
- Transparent pay-per-response pricing that scales with your needs.
- Fast turnaround time, typically ranging from a few hours to a few days.
- Complimentary support from market research experts.
- Intuitive and easy to use, with a minimal learning curve.
- Full-service option where our team manages the entire survey process end-to-end, from survey design to data analysis and reporting.
Let’s dive in.
Pollfish’s Advanced Data Analysis Tools
Traditional process: Traditionally, analyzing survey data means waiting until fieldwork is complete, then building data tables with banner points (different data segments) that generate Microsoft Excel tables for each question. You then spend hours manually reviewing data, creating custom charts in Excel, and copy-pasting insights into your final report.
Our solution: Pollfish eliminates the need for Excel entirely by providing all the data analysis and manipulation capabilities you need directly in our platform — much faster and easier.
In a nutshell: You can start your analysis in real-time as responses come in, even before your survey is fully complete. We provide auto-populated charts for each question, easy drag-and-drop segment building, and custom chart creation. You can export everything into an editable Microsoft PowerPoint spreadsheet with customized templates and colors.
Up next, we’ll dive into Pollfish’s key data analysis capabilities in more detail.
Multiple Ways to View Survey Results

Pollfish lets you view and analyze your survey results in several formats:
- A table view showing each question, answer choices, and the count or percentage of respondents per answer.
- Visual options like color-coded columns or pie charts that make it easy to see the distribution of responses at a glance.
Targeting Filters to Drill Into Specific Subgroups
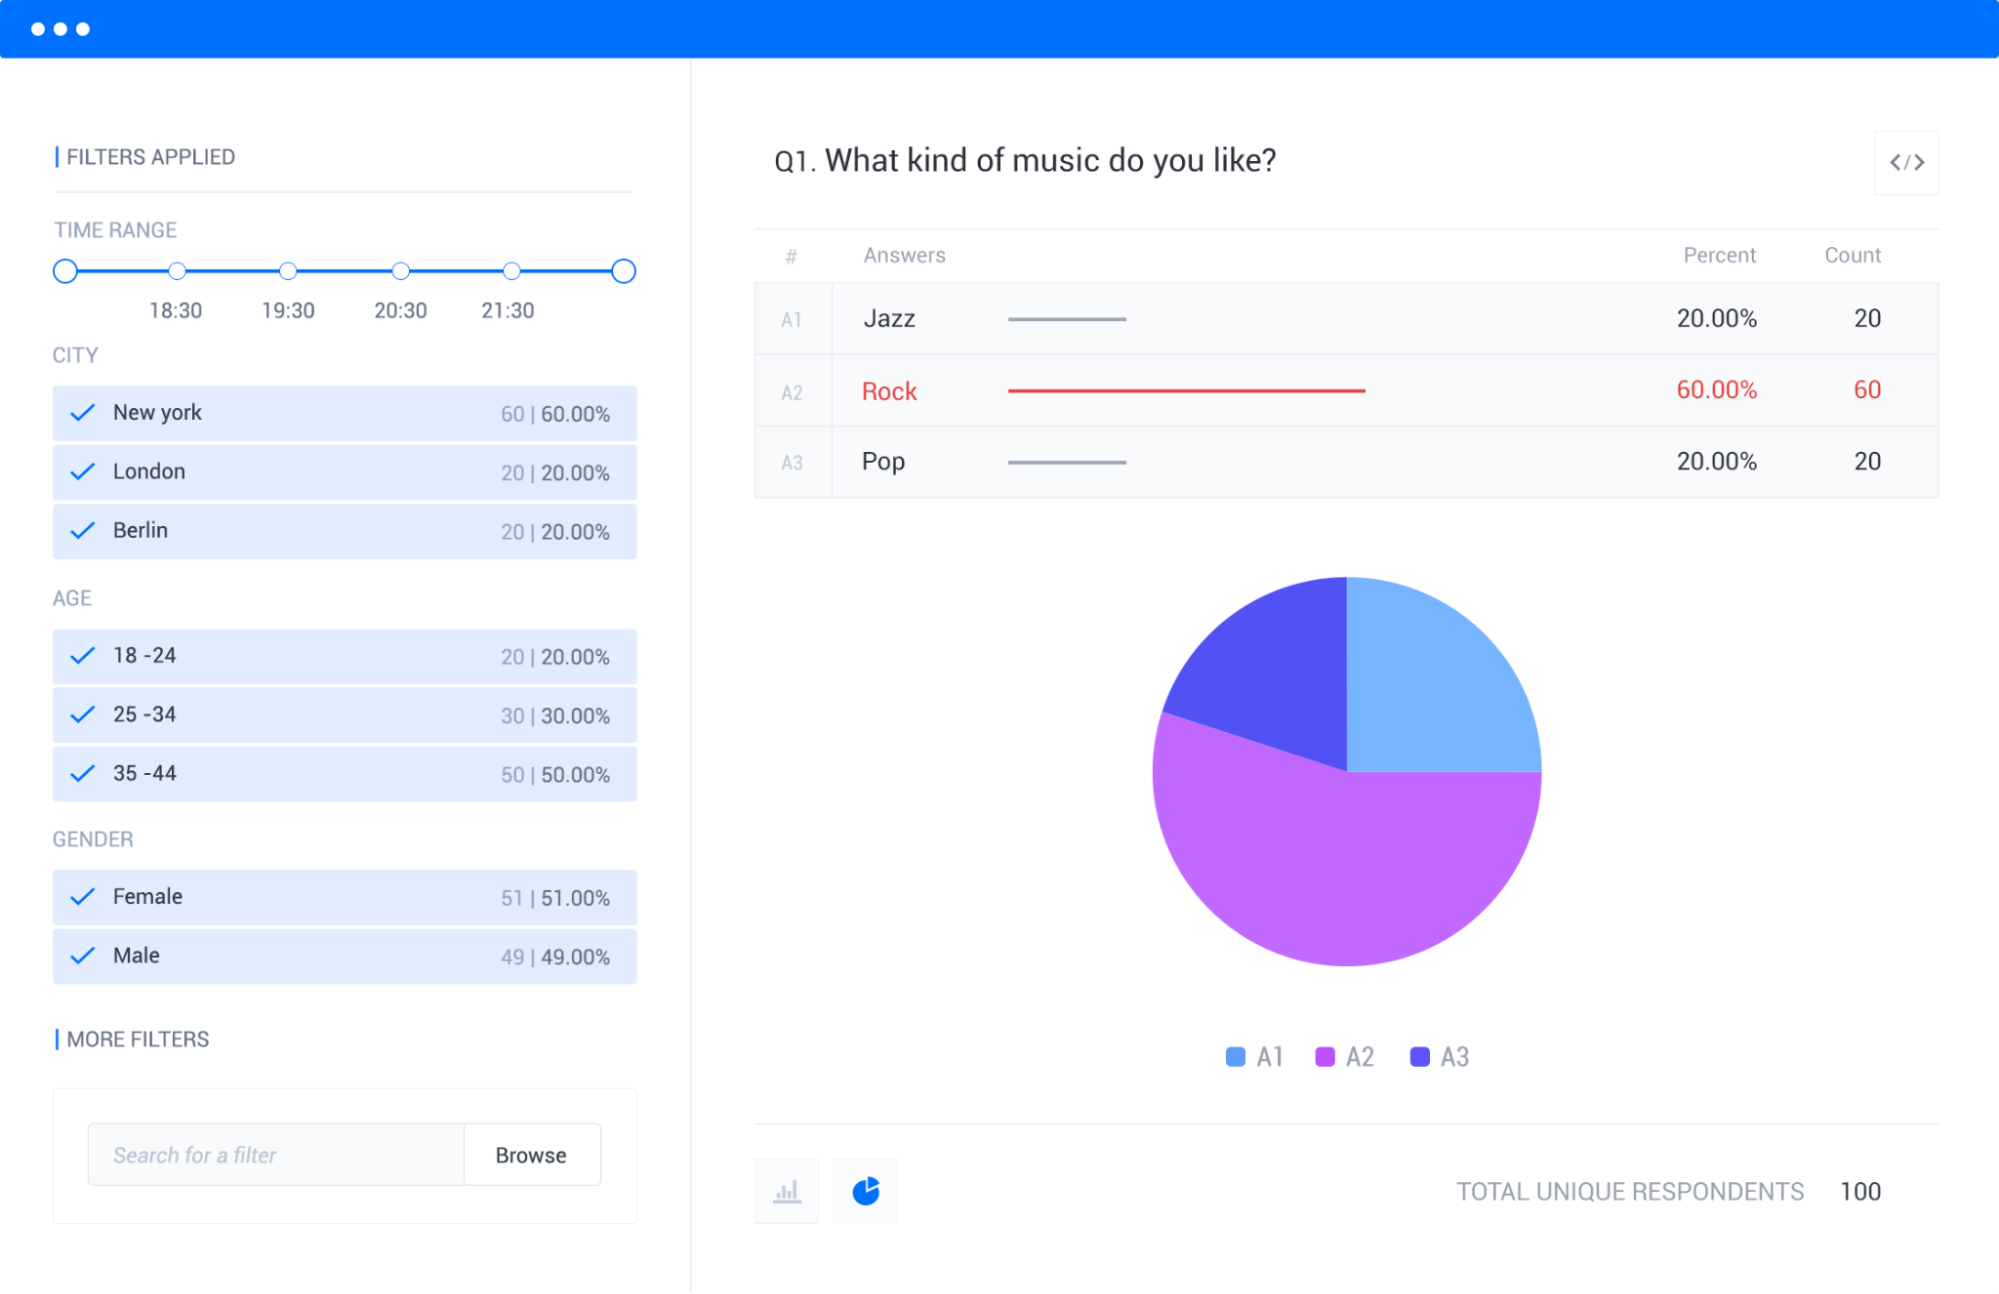
Pollfish makes it easy to focus on the exact audience segments you want to analyze.
You’ll see your targeting criteria on the left side of the dashboard. From there, you can apply filters for specific subgroups or demographics, and your results will automatically update to match.
For example, for the question “What kind of music do you like,” you can filter results by the respondents’ city, age, gender, and more.
You can also combine multiple filters to view very precise groups (e.g., women aged 25 to 34 in Berlin who indicated they’re highly likely to use your product).
Response-Based Filtering

Pollfish lets you refine your data based on specific survey responses.
For example, you can filter results to show only respondents who like Rock music. The platform then automatically updates all related questions — like “Who is your favorite Rock band?” — so you can see how this specific group responded.
This makes it easy to explore relationships between questions and uncover deeper insights without exporting your data or running separate analyses.
Insights Builder for Advanced Data Manipulation and Analysis

Insights Builder, available for high-volume users, lets you analyze your survey data without ever leaving the platform.
You can easily create multi-variable charts, apply statistical significance testing in just a few clicks, and build custom visualizations in your brand’s colors all without the tedious setup work of tools like Excel or Google Sheets.
For example, say your survey asks, “Which of the following social media platforms do you log into at least once a week?”
With Insights Builder, you can quickly manipulate variables to see only the data you want:

For example, you can deselect the “Not Specified” gender group on the left side, and the chart instantly updates to show results for male and female respondents only.
To dive deeper, you can also turn on statistical analysis testing for any chart. The darker the green, the higher the level of significance.
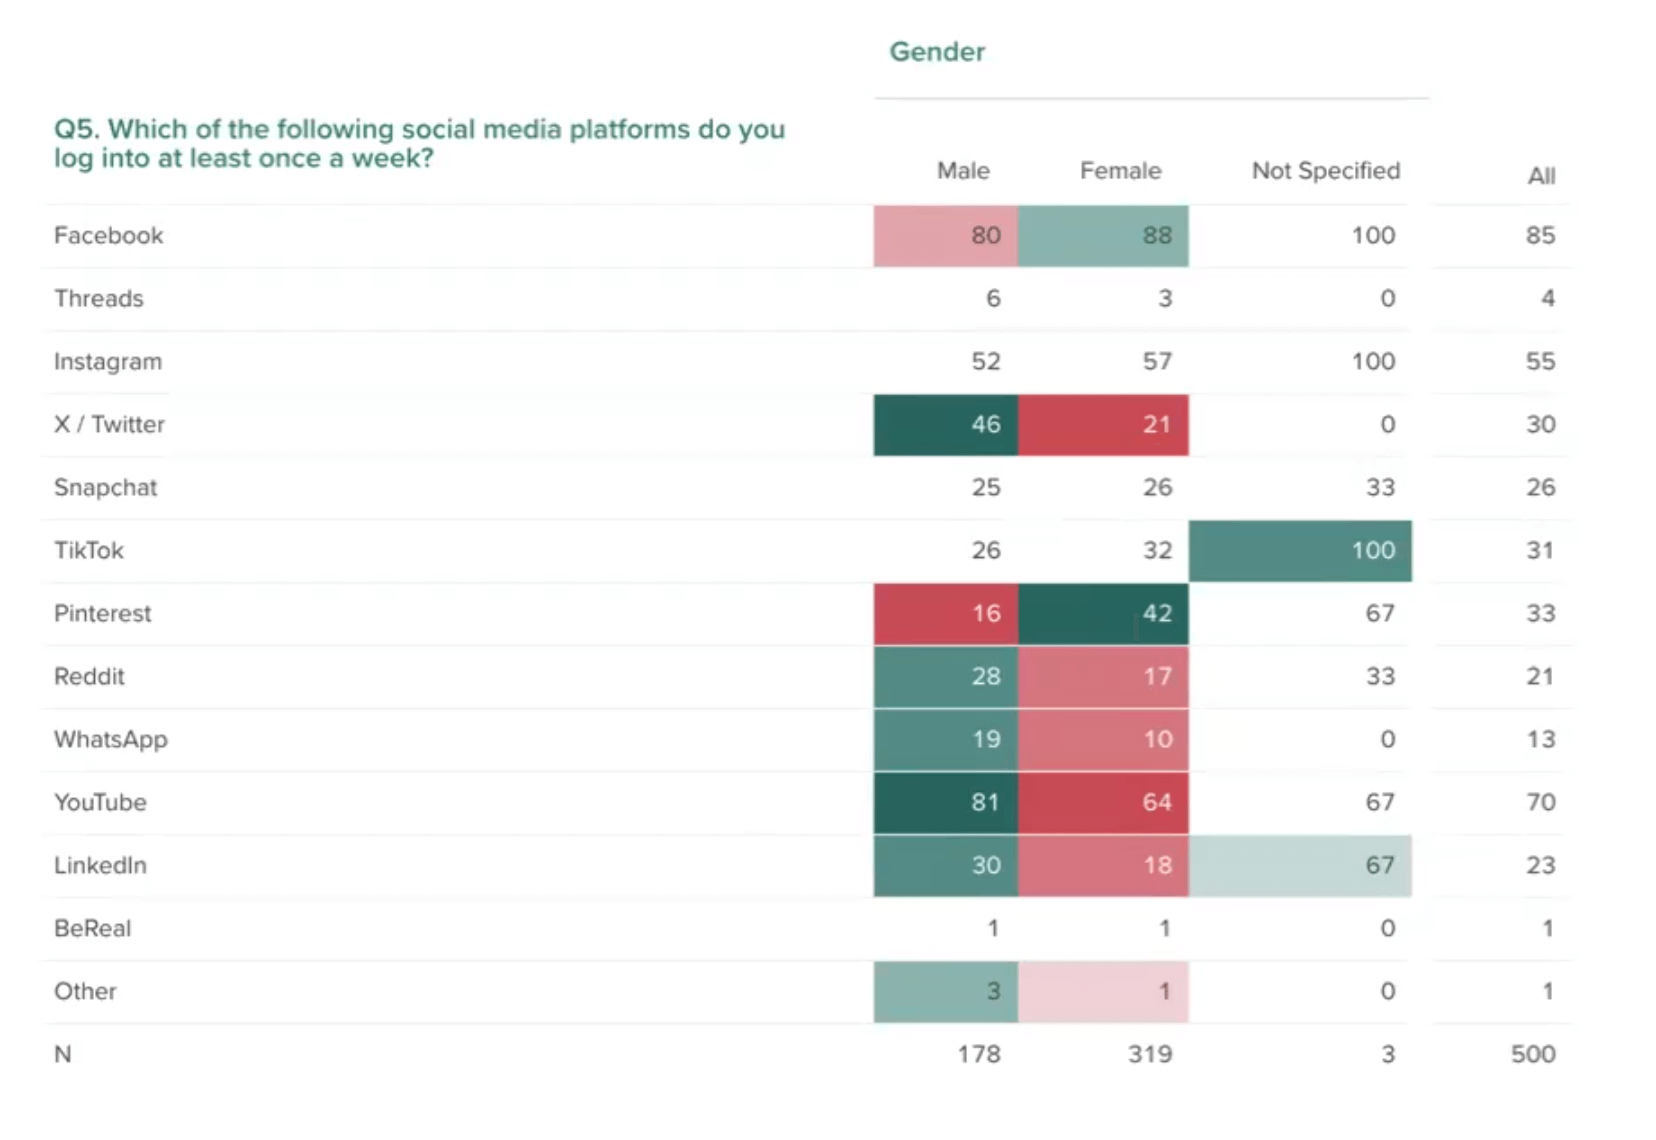
This lets you easily identify valuable insights at a glance. For example, you can see that Pinterest heavily skews towards female users.
You can even apply your brand’s color palette or cohesion across all visualizations or upload your PowerPoint template so that every chart automatically adopts your presentation’s design elements.
Flexible Export Options to PDF, Excel, Crosstabs, or SPSS
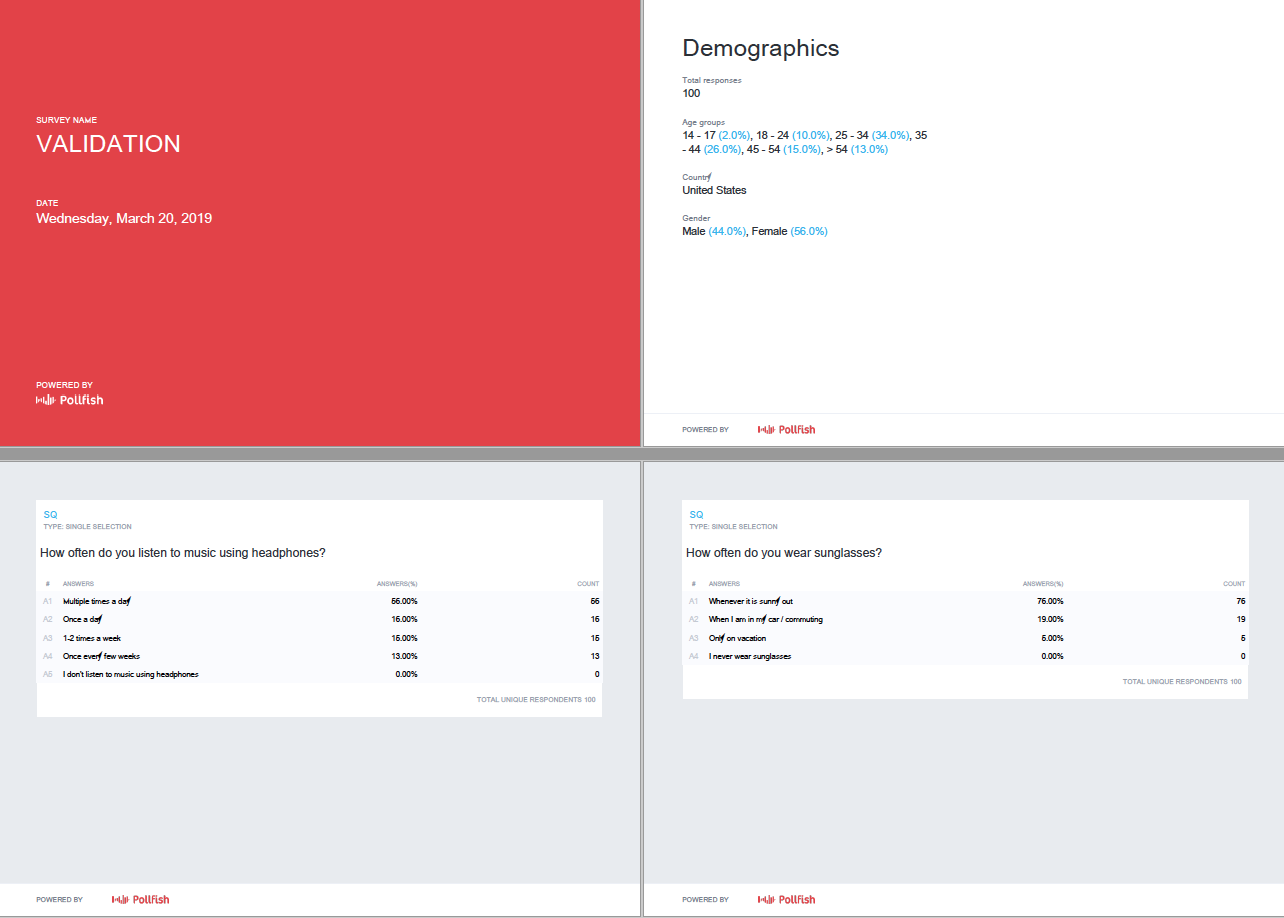
Pollfish offers multiple export options so you can analyze and present your data in the format that works best for you:
- Excel
- Crosstabs
- SPSS
Learn more about how to export survey data with Pollfish (and what to do with it).
Let Our Research Team Handle Your Data Analysis
If you’d rather hand off the analysis entirely, our research team (through our parent company, Prodege) can manage the entire process for you, from data analysis to report creation, so you can focus on other areas of your day-to-day. Reach out here for more information.
In addition to Pollfish’s powerful data analysis tools, other key benefits of our survey software include:
- Rigorous audience data quality measures
- Transparent pay-per-response pricing
- Fast turnaround time
- Complimentary support from market research experts
- Intuitive and easy to use platform
Up next, we’ll dive into each benefit and explore customer reviews.
Rigorous Audience Data Quality Measures
Poor data quality turns surveys into expensive guesswork, and many survey platforms fail to safeguard against common data quality problems, such as:
- Bots posing as real respondents
- Outdated respondent profiles and demographic information
- Respondents providing contradictory or rushed survey responses
At Pollfish, we address these issues with rigorous data quality measures through our parent company Prodege, the world’s largest single-panel owner. These include:
- Diverse activities beyond surveys: We verify users are genuine by monitoring their activity across our panels: uploading shopping receipts, watching videos, playing games, and more.
- 14-day evaluation period: New panelists must undergo a two-week vetting phase before being allowed into client surveys, helping us identify and remove low-quality respondents early.
- Quality trust scores: Our machine learning algorithms track each person’s response quality. Better responses unlock more earning opportunities, rewarding quality participation.
- Manual review of open-ended responses: Our team checks every open-ended response to catch contradictions or rushed entries that automated systems might miss.
Note: You can read more about our approach in our article 3 survey data quality issues sabotaging your research (& how we fix them).
As several of our customers shared:
“The most important point to make is that I trust the responses of my survey. My target audience was very specific and I could tell that the responses were legitimately coming [from] subjects in my target audience.”
“Each time I use this service I am blown away by the speed with which the responses come in and with the detail which most of them include. You can tell that the respondents take this very seriously. They must really enjoy doing it.”
“I had to get some data on a product in a tricky sector. It was proving challenging to attract participants to my study. I was able to quickly get results and some insights to be able to move forward with my work using Pollfish.”
Transparent, Pay-per-Response Pricing that Scales with Your Needs
With Pollfish, what you see is exactly what you pay.
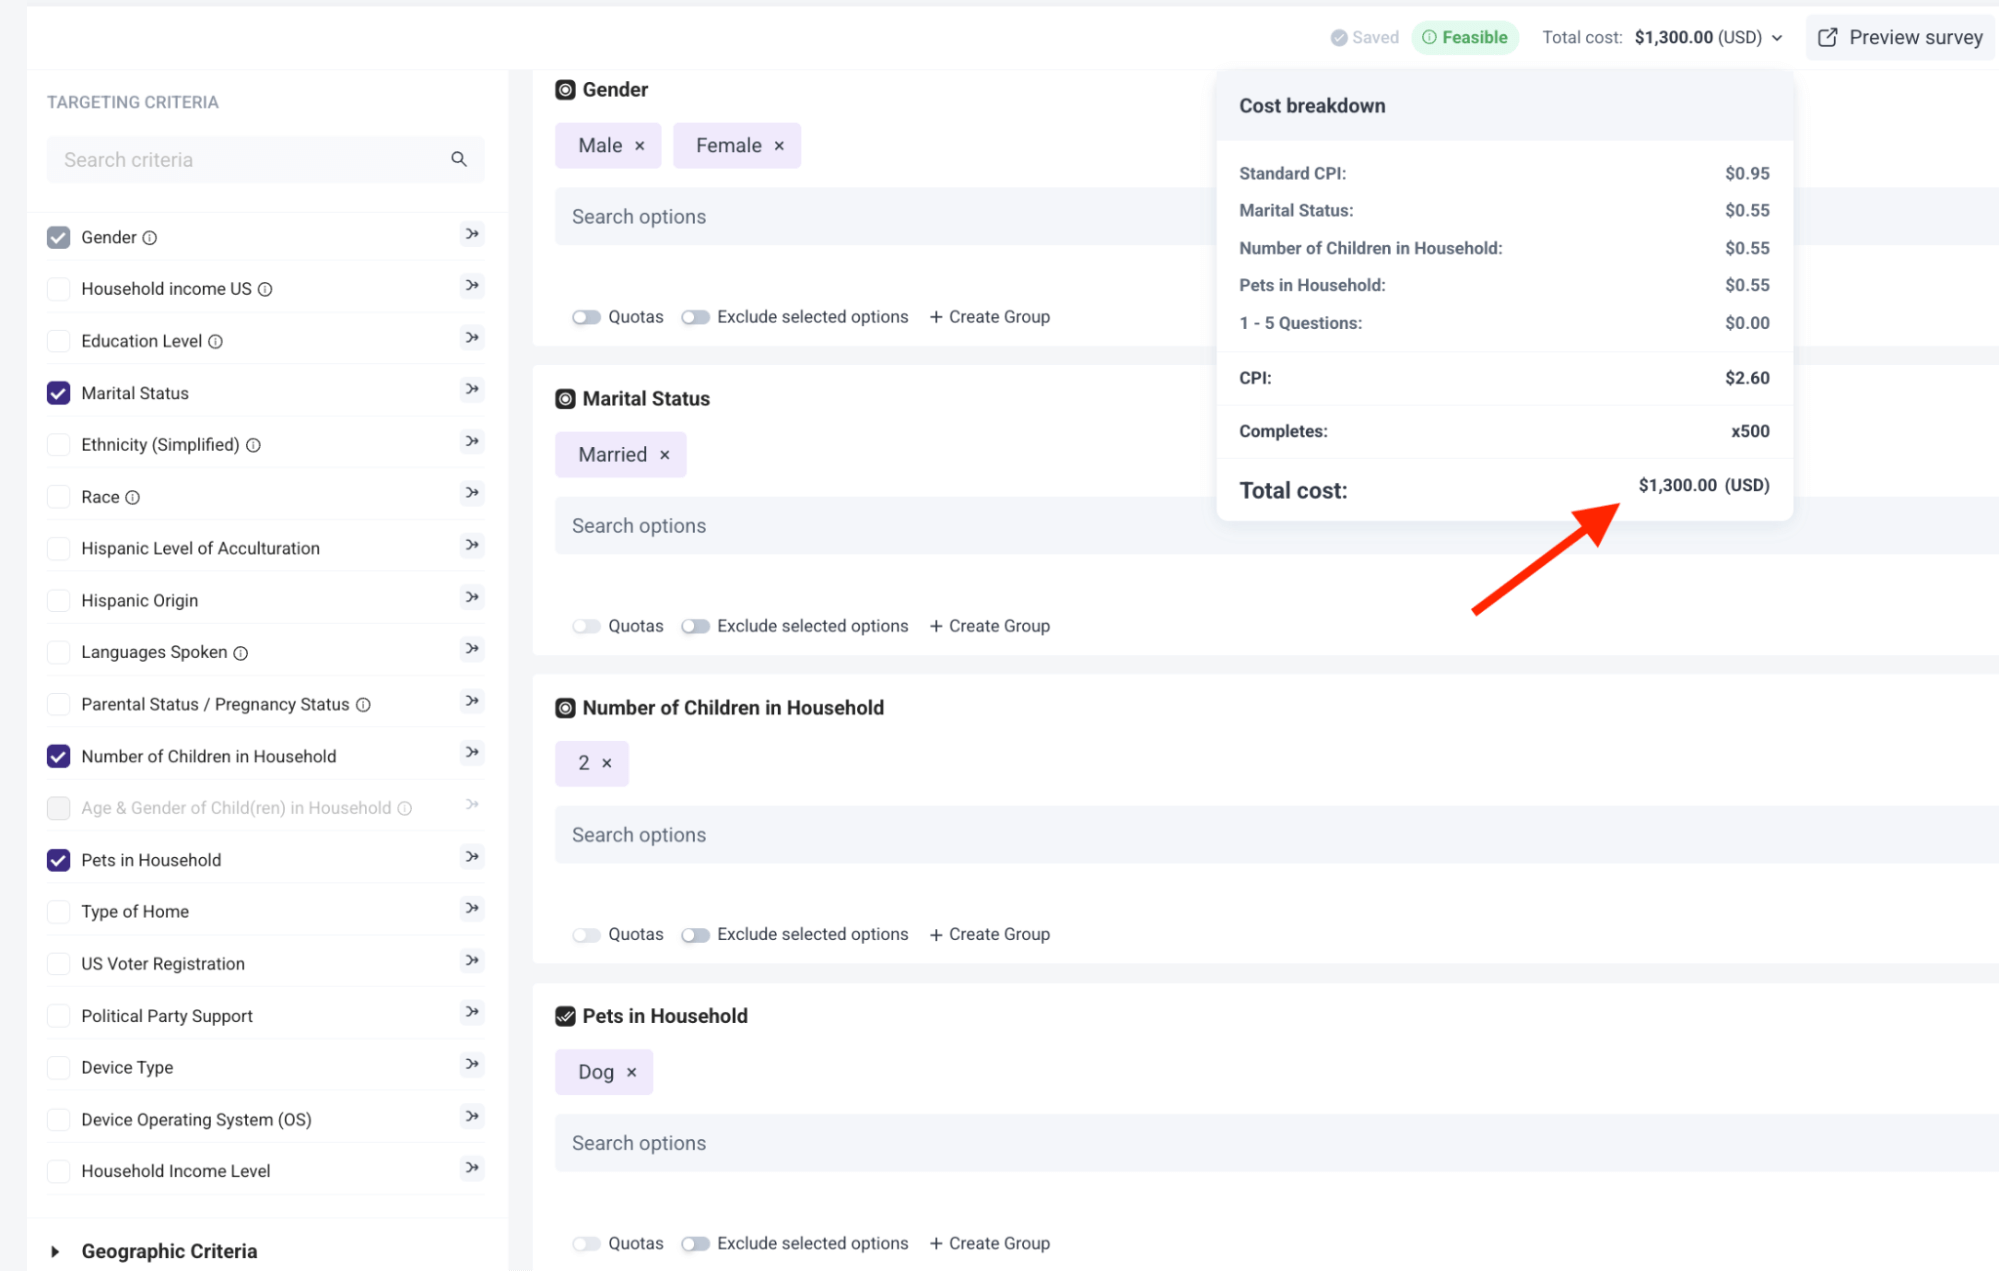
We offer straightforward pay-per-response pricing starting at $0.95 per response. This includes full access to our data-rich survey results dashboard, where you can filter and analyze your results in real time.You can view an interactive demo of our dashboard here.
As you create your survey, the cost per response and total price update in real-time in the upper right hand corner, so you see exactly what you’ll pay before going live. You’ll always know your survey cost upfront — no hidden fees, no surprises.
As several customers have noted:
“They charge based on the completed response. It is very fair and transparent. As a researcher, I have used many survey platforms, but they are the best so far.”
“The dollar amount they quote you in their cost calculator tool, and the number they show when you’re developing the survey, is the number you pay. I was burned multiple times by [competitor] charging me unexpected amounts and making it difficult to quit an expensive subscription. I’m so happy to have found Pollfish as an alternative. Their support team also responds VERY quickly to chat messages and has been tremendously helpful the few times I had questions.”
“We had been looking for a pay-as-you-go insights platform and this one didn’t disappoint! Has a ton of capabilities and the AI suggestions are actually helpful.”
“The pricing is clear and transparent from the beginning. The results come quickly and can be downloaded in different formats and with different filters. What we like most is the ability to filter the results and analyze them separately for each segment. We highly recommend this platform.”
Fast Turnaround Time (Few Hours to a Few Days)
By tapping into Prodege’s first-party audience network, we can deliver results faster than most survey software.
Broad population surveys (e.g., U.S. adults) can be completed in just a few hours. More specific audiences (e.g., camping enthusiasts who own a dog) naturally take longer, typically a few days.
As we mentioned above, you don’t have to wait for all responses to come in before analyzing results. As data starts populating, you can view and explore it live in your dashboard, adjusting filters and visualizations in real time.
As several of our customers have noted regarding Pollfish’s fast turnaround times:
“I needed a 25 question survey answered, and was able to get 500 completed surveys in 8 hours with Pollfish. The presentation of the results is very impressive and the demographics information Pollfish provided is invaluable.”
“The thing that amazes me most is how quickly you can get your data results back. So fast! Usually in a couple of hours.”
“I’m amazed at how quickly the platform was able to deliver rich, segmentable data from over 500 respondents. I had feature-ready insights in only 3 days.”
“I found the platform super-easy to use and we received feedback on our new name and logo from our target audience within a few days.”
Intuitive and Easy to Use Platform
Whether you’re new to survey creation or a seasoned market researcher, Pollfish is easy to use for anyone.
Our DIY survey builder, prebuilt templates, and AI survey tools make creating surveys fast and user-friendly. When responses arrive, our built-in analysis tools make the process much simpler and faster, compared to Excel and other external platforms.
As several of our customers noted:
“Pollfish is probably the single easiest software I’ve ever used. The drag and drop builder is great itself, but the template library also has anything we ever need, so you rarely have to design anything from scratch. The templates are also designed very well, we usually pick one, do a couple edits, and deploy. The whole thing takes less than 10 minutes.”
“The surveys were easy to set up, allowed me to select my very specific target and launched right away. Within a couple of days I had my results in an easy to interpret, actionable format well within my budget.”
“I have used this platform ~10x over time and find the process easy, their review process helpful, and the insights I get from people valuable as I work through different product concepts in market research. Their pricing is more reasonable than other competitors I’ve looked into, and am happily going to continue using Pollfish.”
Complimentary Support From Market Research Experts
Exceptional customer service is one of our core values. With Pollfish, you get direct access to experienced market research professionals, not just basic tech support.
Our team can guide you through every stage of your project: from the early stages of designing your questionnaire and choosing the right audience to filtering, analyzing, and interpreting your data results.
Support is available 24/7 by chat or phone, including evenings and weekends, so you can get expert help whenever you need it.
As some of our customers shared:
“The customer service team is super responsive too for those more complex enquiries about the tool and criteria. All in all this experience has been way easier (and cheaper) than any other ‘big players’ out there.”
“I love this product. I feel like it gives me enterprise grade market survey tech at a consumer price. Highly recommend. I love how responsive the customer support team is.”
“The customer service I received was fantastic. Brilliant guidance that helped get high-quality results. I was really pleased with the outcome and highly recommend using them.”
Get Started With Pollfish
We invite you to:
- Create a free account, no credit card required.
- Inquire about our end-to-end market research services
2. Qualtrics
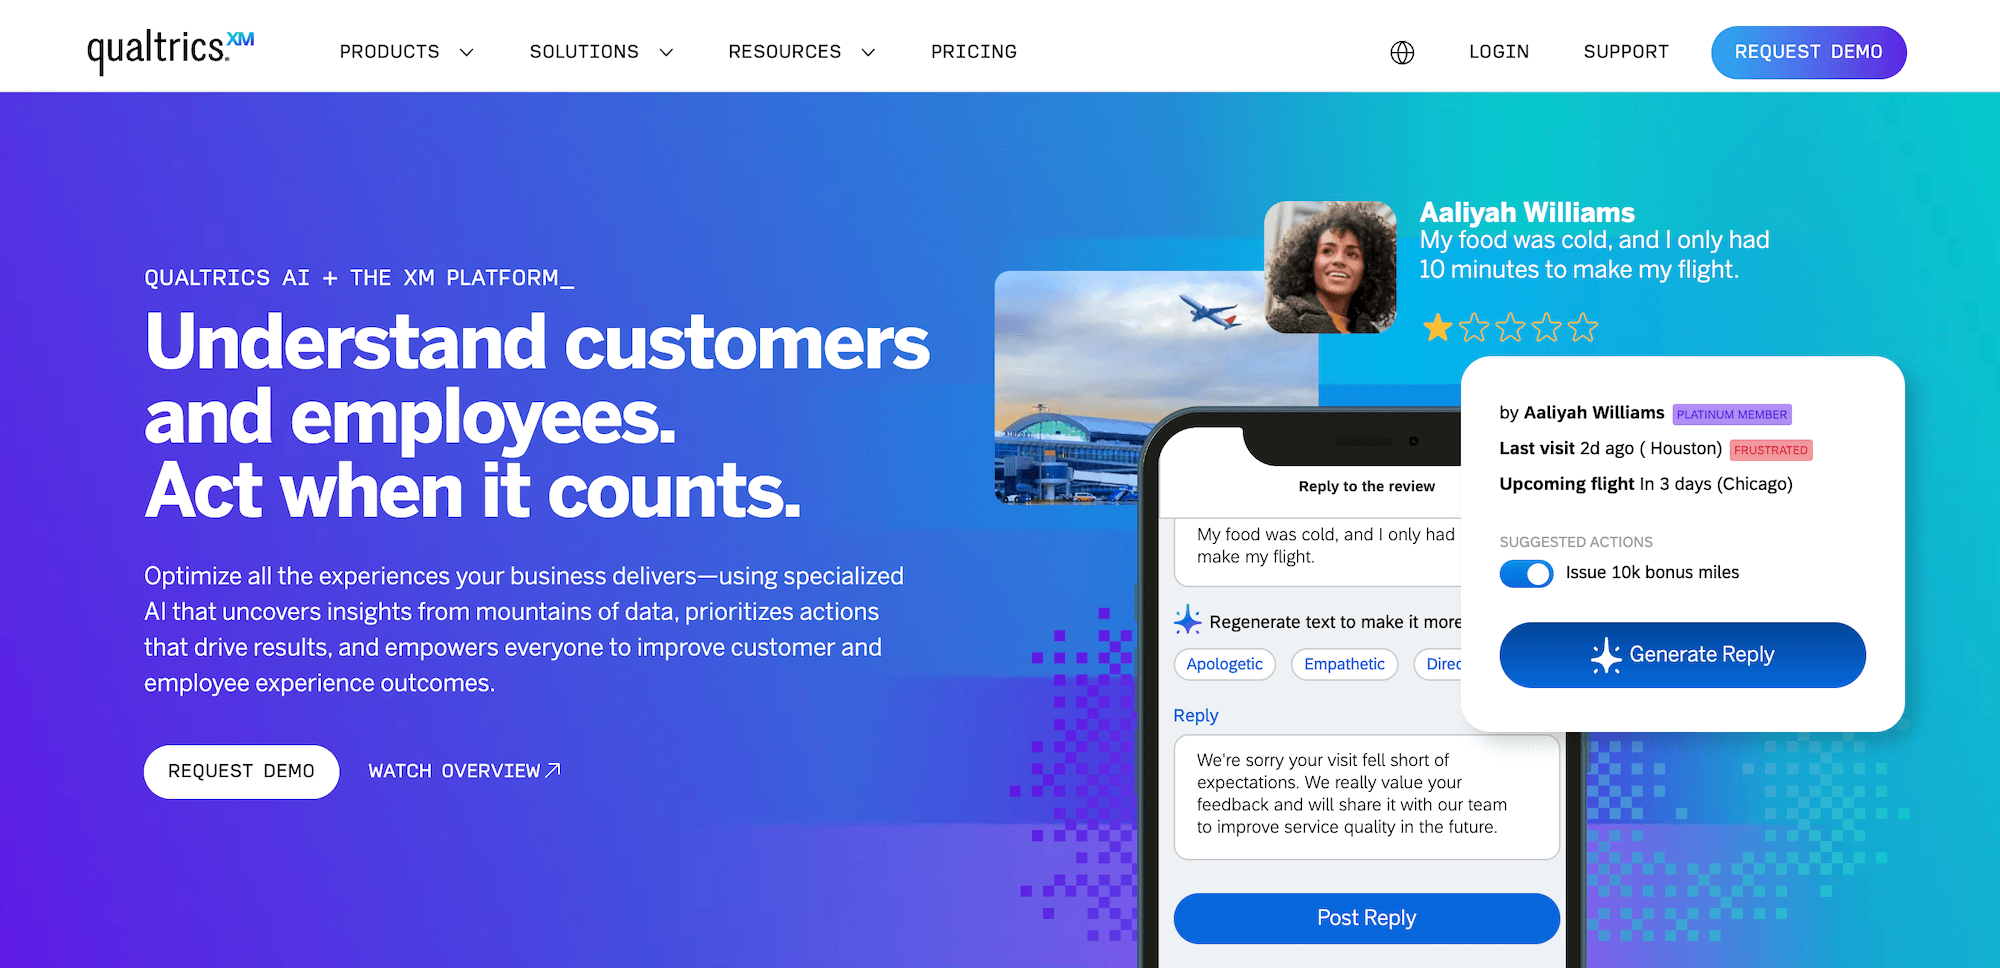
Qualtrics is a solid survey software with built-in data analysis tools. However, some customers have found that the high monthly cost doesn’t align with their budget requirements.
They break down their features into 3 categories:
1. Customer Experience
- Voice of Customer
- Omnichannel Experience Management
- Digital Experience Analytics
- Website & App Feedback
- Location Experience Hub
- Online Reputation Management
- Contact Center Analytics
- Quality Management & Compliance
- Agent Coaching
- Edge Instant Insights
2. Employee Experience
- Employee Engagement
- Employee Pulse
- Employee Research
- Candidate Experience Management
- Employee Onboarding & Exit
- 360 Development Feedback
- Employee Retention Analytics
- Continuous Employee Listening
3. Strategy & Research
- Strategic Market Research
- Product Research
- Brand and Communication Research
- User Experience Research
- Edge Audiences
Read more about how Pollfish compares to Qualtrics in our article on the best Qualtrics competitors & alternatives.
3. Alchemer

Alchemer is another online survey software with data analysis capabilities and actionable insights.
Some of their key features include:
- Advanced customization
- Logic and branching
- 43 survey question types
- Multichannel deployment
- Instant reporting
- Easy segmentation
Read more about how Pollfish compares with Alchemer in the best Alchemer alternatives & competitors.
4. SurveyMonkey
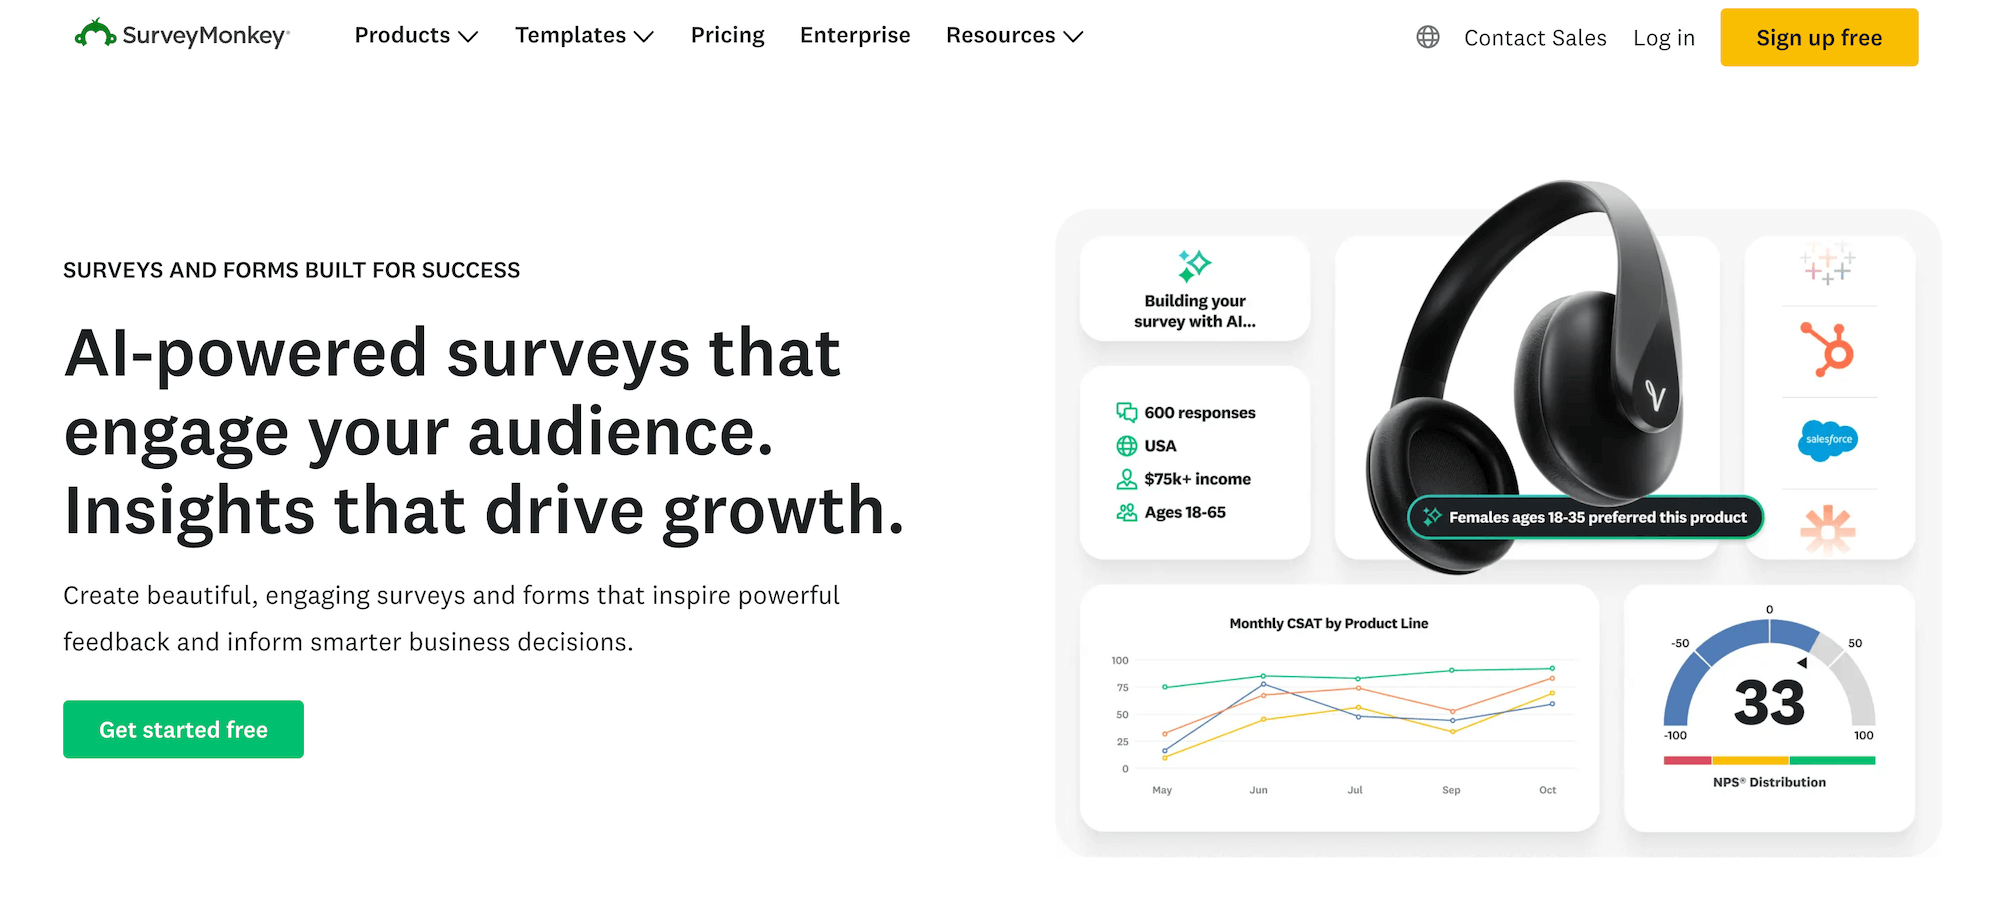
SurveyMonkey is a survey tool that also offers built-in analytics and reporting.
Some of their key features and capabilities include:
- AI-driven survey analysis
- Thematic analysis for open-ended text responses
- Automatic chart creation
- Ability to filter responses
- Statistical significance
- Integrations with Tableau and PowerBI
Read more about how Pollfish compares to SurveyMonkey in the best SurveyMonkey alternatives & competitors.
5. Suzy

Suzy is another market research software that offers built-in data analysis features. Some of their use cases include:
- Attitudes and Usage
- Tracking
- Feature Testing
- Package Testing
- Price Testing
- Positioning
- Message Testing
- Path to Purchase
- Retailer Sell-in
- Heatmapping
Read more about how Pollfish compares to Suzy in the best Suzy competitors & alternatives.
6. MAXQDA

MAXQDA is an analytics platform focused on qualitative data analysis.
Some of their key features and solutions include:
- Interview Transcription & Analysis
- Literature Review & Analysis
- Mixed Methods
- Content Analysis
- Questionnaire Analysis
- Visualization
- Quantitative Text Analysis (MAXDictio)
- Statistical Survey Data Analysis
7. Displayr

Displayr is an AI-powered analysis software and reporting solution.
Some of their key features and capabilities include:
- Survey Analysis
- Data Cleaning
- Data Visualization
- Story Finding
- PowerPoint Automation
- Automatic Updating
- Dashboarding
- Data App Building
Interested in Trying Out Pollfish?
We invite you to: