7 Best MaxDiff Analysis Tools in 2026 (In-Depth Look)

In this post, we’ll discuss the best MaxDiff analysis tools on the market.
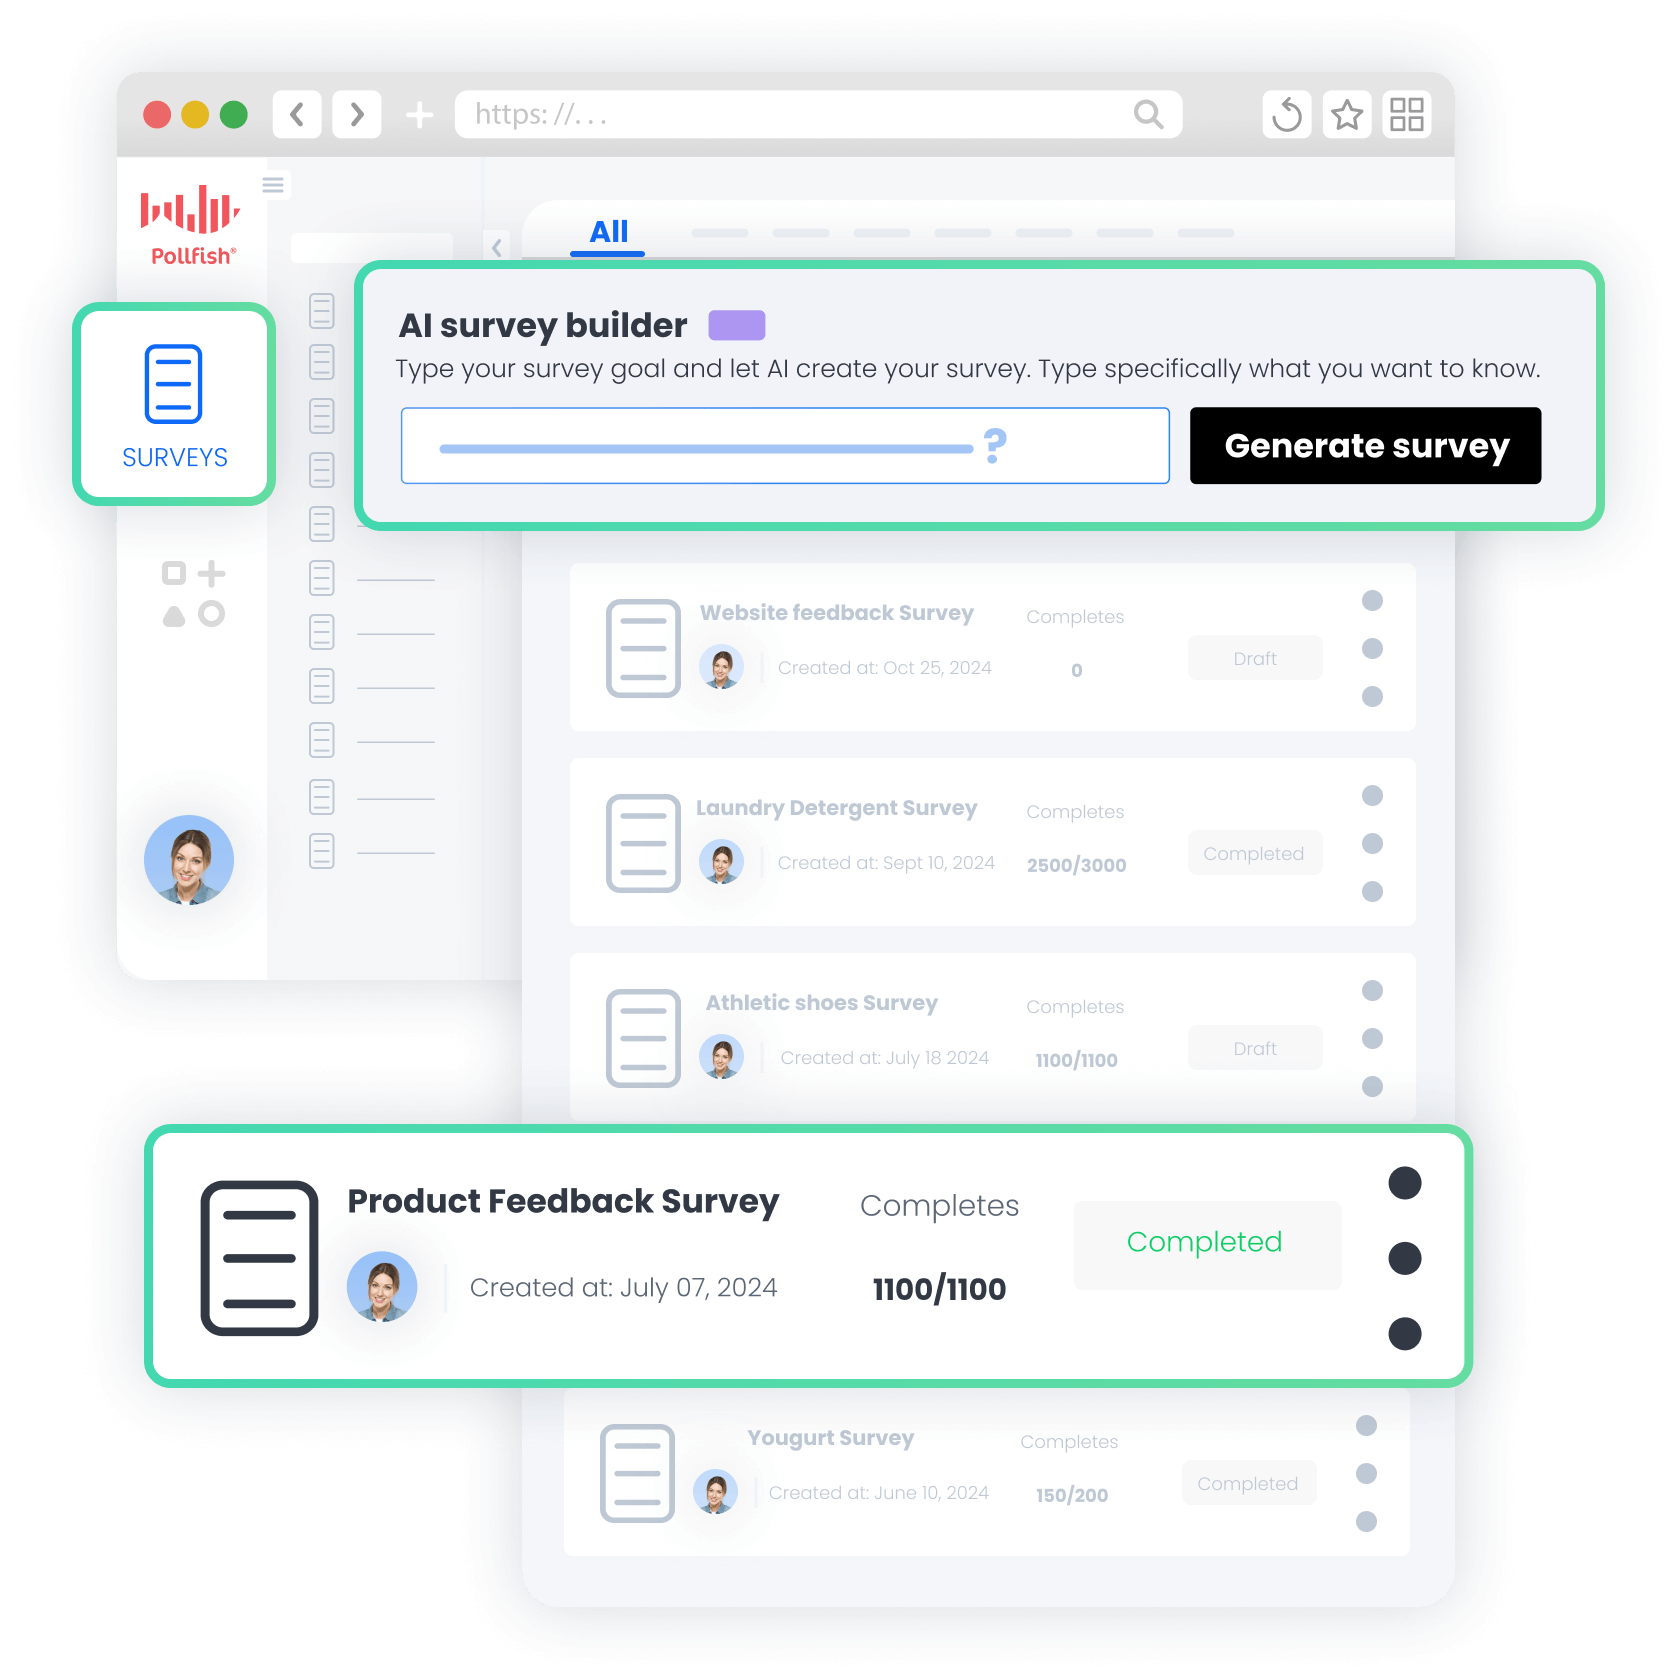
We’ll start with our own tool, Pollfish. Our powerful MaxDiff survey design tools give you precise control over every detail. Pre-built templates and our AI Survey Builder make setup fast. And our built-in data analysis tools make it easy to interpret your MaxDiff survey results, no spreadsheets or external software required.
We’ll also discuss other MaxDiff analysis tools to help you choose the one best-suited to your needs.
Best MaxDiff Analysis Tools
Note: Create a free Pollfish account (no credit card required) to explore our DIY survey tool and powerful MaxDiff analysis capabilities, or inquire about our end-to-end market research services.
1. Pollfish

In this section, we’ll discuss:
- An overview of how to create MaxDiff surveys with Pollfish. In addition to building your survey from scratch, there are two easy ways to save time:
-
- Use our MaxDiff survey template to get started, then edit to your liking.
- Use Pollfish’s AI Survey Builder to create and customize your MaxDiff survey in minutes, all through chatting with our AI.
- How to analyze MaxDiff analysis results within Pollfish. While you can always export survey results, Pollfish has everything you need to extract key insights from your MaxDiff surveys built right into the platform. The interface is intuitive and easy to use, so you can get to insights faster with less hassle.
- Key reasons to choose Pollfish for MaxDiff analysis, including:
- Rigorous data quality measures for survey results you can reliably base decisions on.
- Pay-per-response pricing with no subscriptions or hidden fees.
- Fast turnaround time ranging from a few hours to a few days.
- Complimentary support from seasoned market researchers available 24/7, including nights and weekends.
- Intuitive and easy to use, so you can quickly launch MaxDiff surveys with minimal learning curve.
- Our full-service option, fulfilled through our parent company, Prodege. We can help with just one aspect of your MaxDiff analysis, or handle it for you from end-to-end, from design to analysis. Reach out to learn more.
How to Create MaxDiff Analysis Surveys in Pollfish

With Pollfish, you have three flexible options for building a MaxDiff survey:
- Build your survey from scratch
- Use our pre-built MaxDiff analysis template
- Use Pollfish’s AI Survey Builder
Below, we’ll take a look at options 2 and 3 in more detail.
Note: See a video overview of how to create surveys with Pollfish.
Using Pollfish’s MaxDiff Analysis Template
We designed our MaxDiff analysis template to save you significant time by generating a ready-made, editable survey for you.

This process is faster than starting from scratch and is totally customizable to fit your needs.
Note: Pollfish also offers 17 other survey templates, which you can learn more about here.
When using the template, you’ll be prompted to enter your details into our intuitive MaxDiff analysis setup wizard:

As you can see above, Pollfish supports media uploads to add visual elements to your MaxDiff surveys.
Creating a MaxDiff Analysis Survey with AI Survey Builder
Another popular option for creating MaxDiff surveys with Pollfish is to use our AI Survey Builder. As several reviewers noted:
“I’m loving Pollfish’s AI-generated questions — not only are they accurate and time saving, but it even came up with better survey queries than I could have thought of! With a quick poll of 250 respondents in just one working day, targeting my niche market was a breeze. The customer service team is super responsive too for those more complex enquiries about the tool and criteria. All in all this experience has been way easier (and cheaper) than any other ‘big players’ out there.”
– Read the full review here
“I rarely give 5 stars, but this one is well worth it. The interface is super easy whether you create it from scratch or use AI and the value is bar none. I had calls with other companies that wanted to charge me 1000’s and take days to complete. Instead, I signed up with Pollfish, created my survey in less than 30 minutes, and had all 100 respondents in a couple of hours. Saved me so much time and money. Worth every penny!”
– Read the full review here
How it works: Simply enter your survey objective, and the AI will generate a complete MaxDiff survey in minutes. Once created, you can refine it manually or chat with the AI to make adjustments.
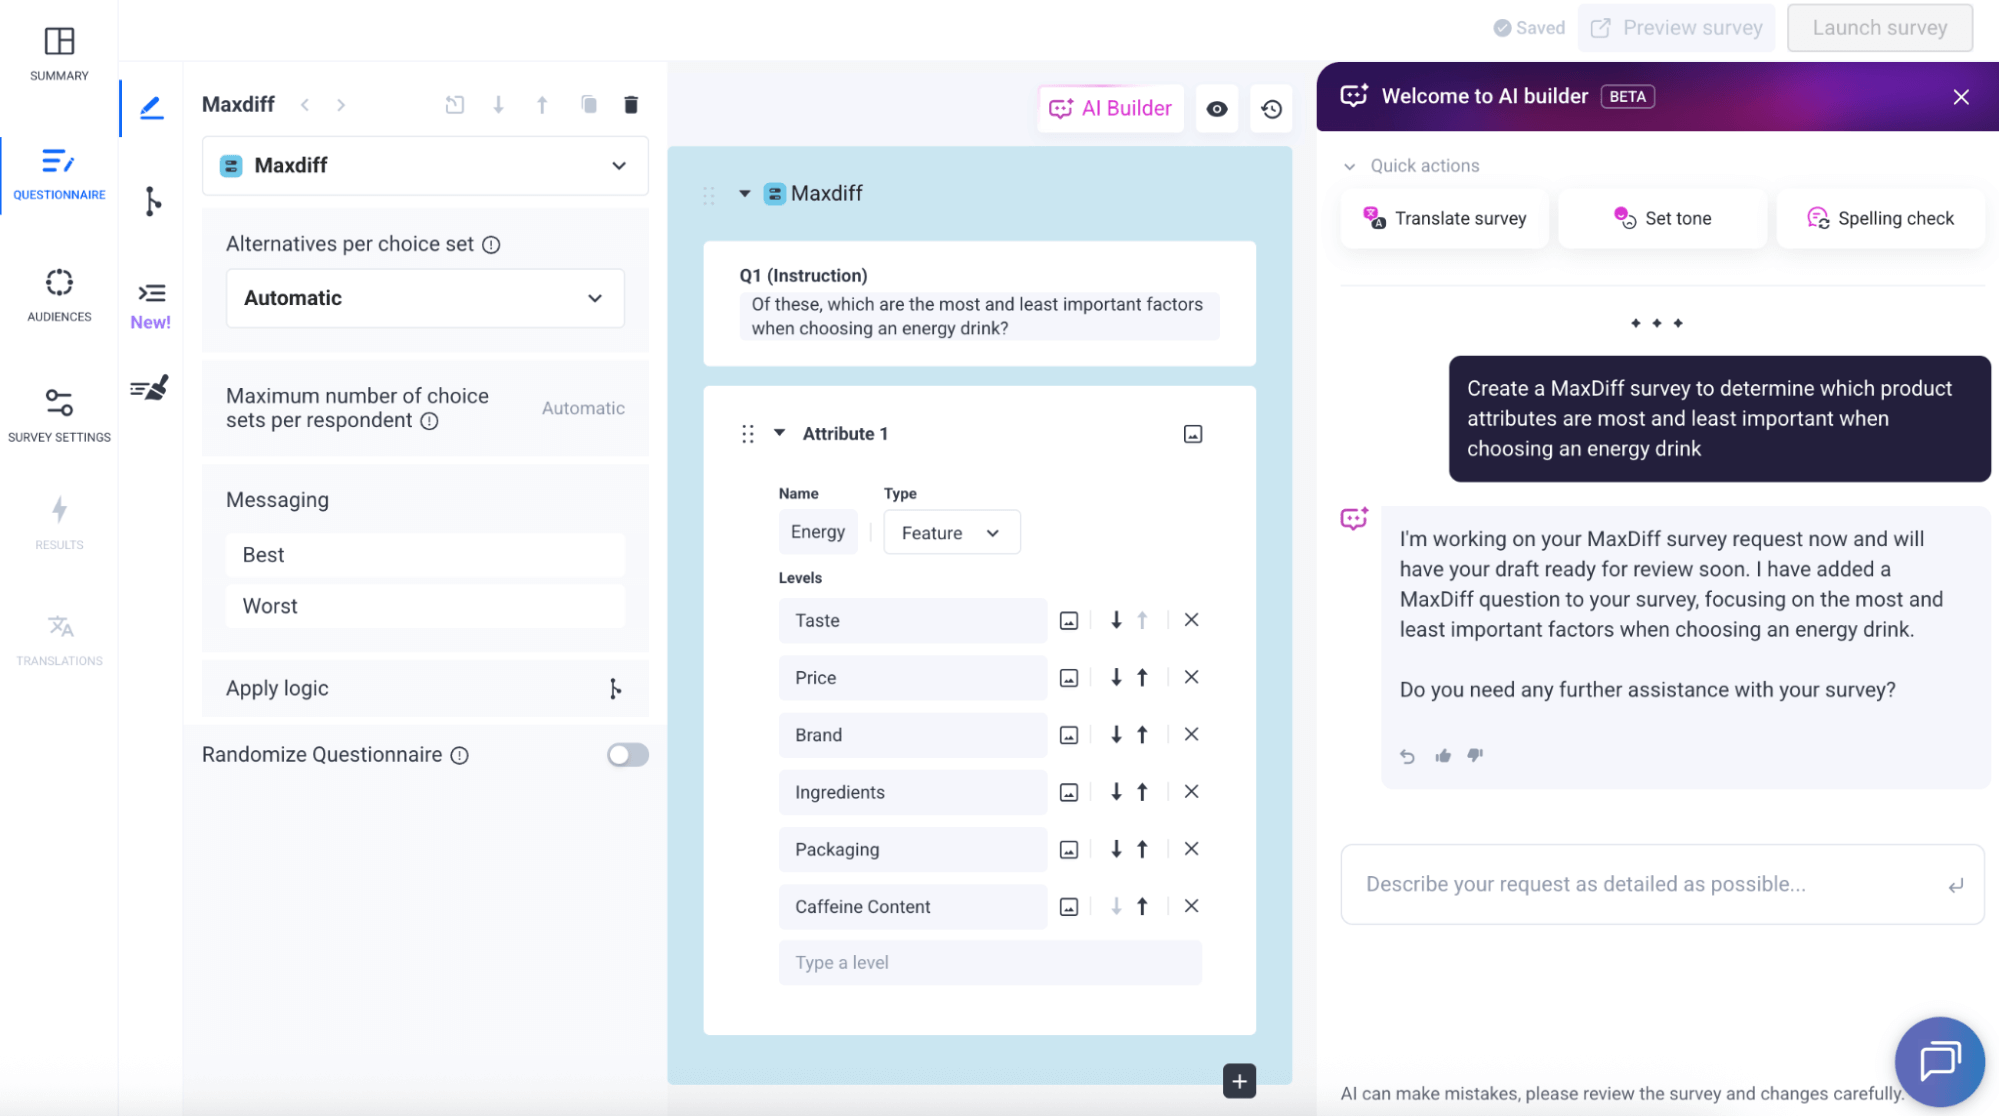
In the example above, the initial prompt used to generate the MaxDiff survey is, “Create a MaxDiff survey to determine which product attributes are most and least important when choosing an energy drink.”
❇️ Customizing Your MaxDiff Survey
Once the initial MaxDiff analysis survey is generated, you can chat with the AI to refine attributes, tailor the survey to specific audiences, add or remove questions, change the tone, translate the survey to different languages, etc. — the sky is the limit.
Here are some examples of questions you might ask the AI to customize or improve your MaxDiff survey further:
- Refine this MaxDiff for health-conscious energy drink buyers aged 25 to 40. Update attributes and wording to reflect that audience.
- Create a second MaxDiff question for retail buyers evaluating energy drinks for shelf placement, with attributes relevant to retailers.
- Add a short open-ended follow-up question asking why the most important attribute was chosen.
- Review all attributes for leading or biased language and rewrite them to be more neutral.
❇️ Applying Sophisticated Survey Design
You can also chat with the AI to implement advanced survey design elements like screening questions, conditional branching, answer shuffling, and more. What once required manual setup can now be configured through a simple conversation with the AI, saving you significant time!
Analyzing MaxDiff Survey Results
The problem with other software: Most MaxDiff analysis tools require you to export your survey results and invest significant time in external tools (such as Excel), filtering data and creating charts manually.
Our approach: With Pollfish, you can effortlessly create custom branded charts directly within the platform, saving you time, effort, and the need for external tools.
Up next, we’ll look at a few examples of MaxDiff analysis charts available in Pollfish. These are just a small sampling — you can visualize your survey results via other types of charts as well.
For a deeper dive on Pollfish’s powerful built-in analysis features, read our article on the 7 Best Survey Software with Data Analysis Tools.
❇️ The Level Utilities Graph
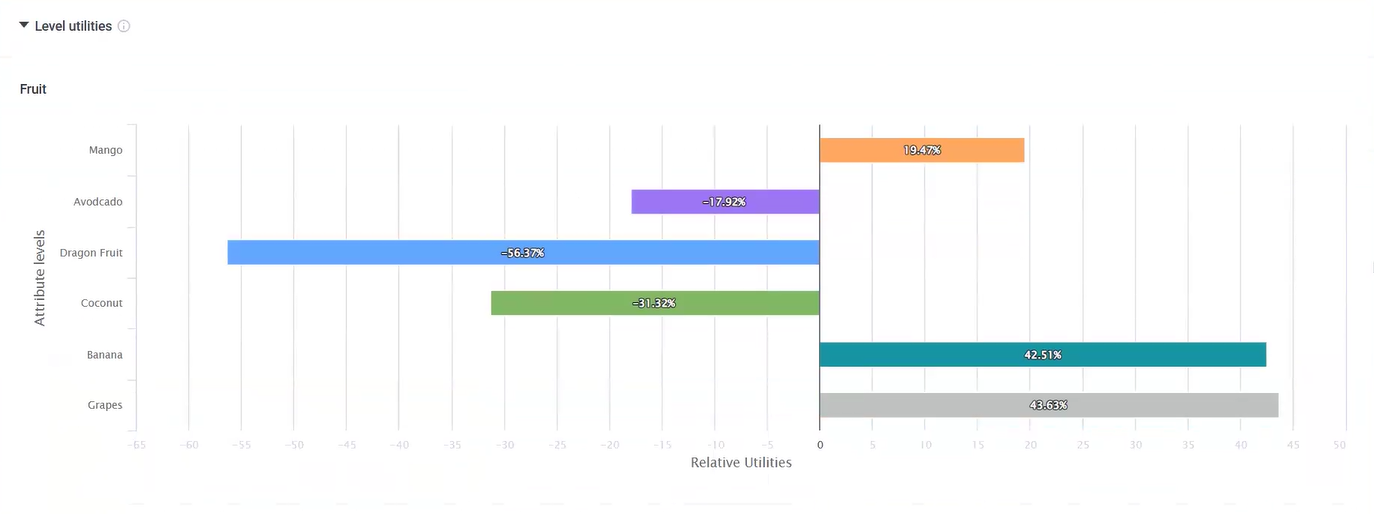
This chart shows how individual levels within an attribute affect preferences. Each level is assigned a utility score that reflects how strongly it influences choice, with higher values indicating stronger preference.
In our tropical fruit example above, fruits to the right of the chart have positive utility scores, meaning they increase the likelihood of being chosen, while fruits to the left have negative utility scores and reduce choice likelihood. The graph shows that grapes and bananas are strongly preferred, while dragon fruit has a strong negative preference.
❇️ The Best/Worst Level Performance Graph
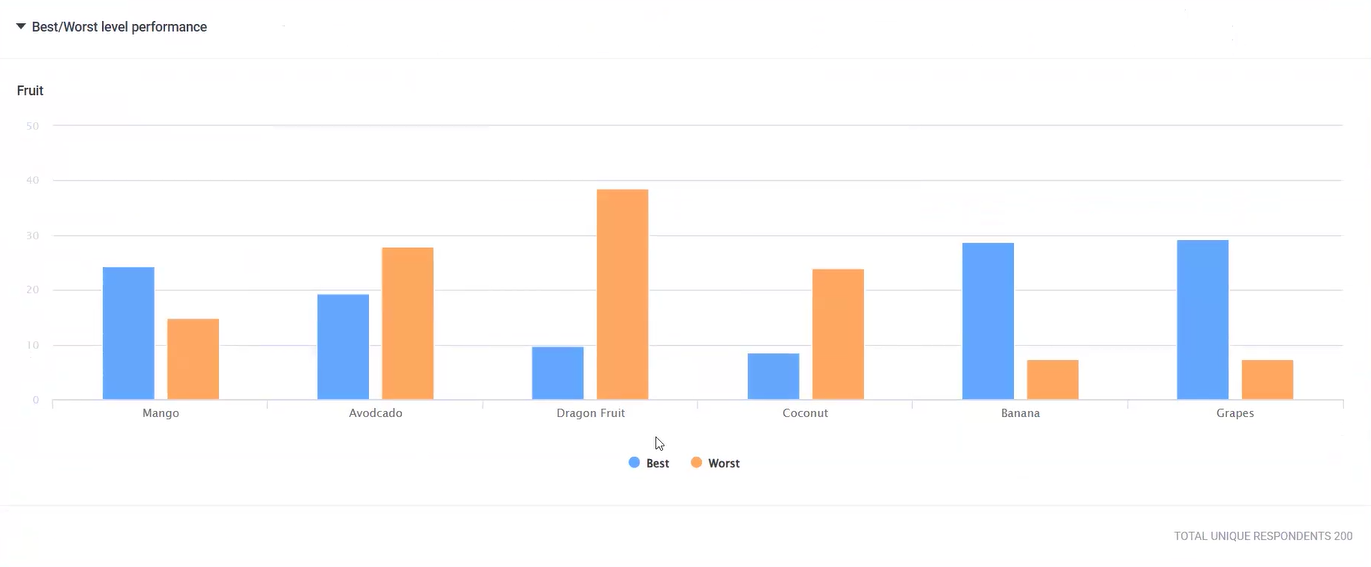
This chart shows the percentage of times that each option was ranked as the best versus the worst, highlighting which levels drive strong positive or negative reactions.
In our tropical fruit example, dragon fruit and avocado were ranked worst more often than the other fruits.
❇️ The Distribution of Level Preferences Graph
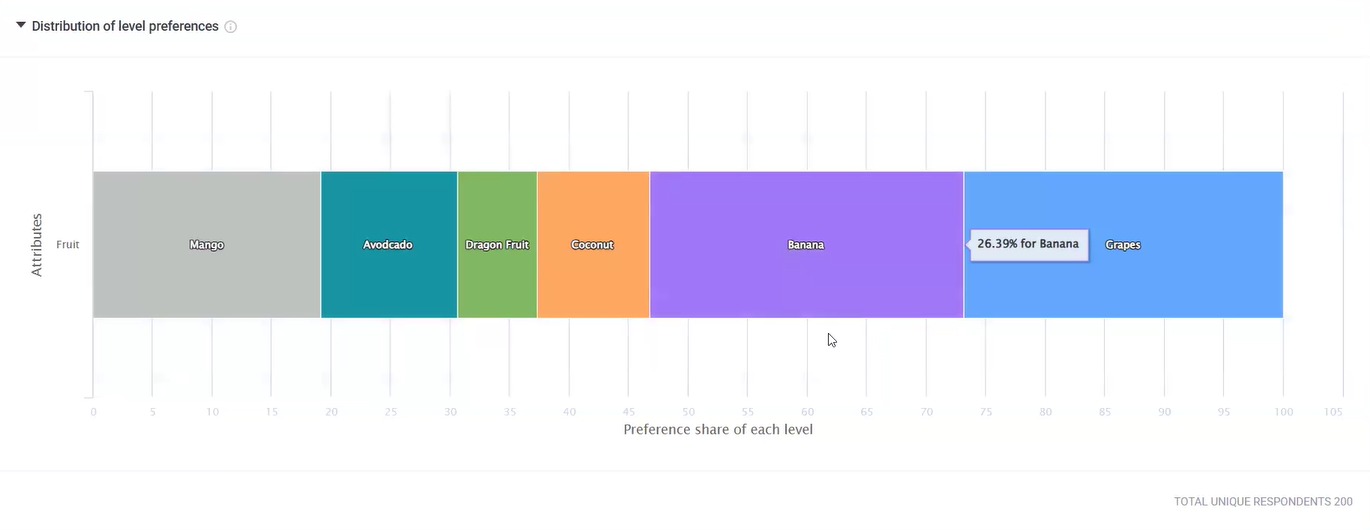
This chart shows the likelihood that a given level would be chosen over other levels within the same attribute when all other attributes are held constant. Higher percentages indicate a stronger preference for that level.
In our example, the graph shows that bananas and grapes account for the largest share of preference, indicating they are most likely to be chosen compared with other fruit options.
❇️ Advanced Chart Creation & Reporting Options

For power users, we also offer Insights Builder, which lets you create sophisticated multi-variable charts in your brand colors with ease, saving significant time compared to tools like Excel.
❇️ AI Reports
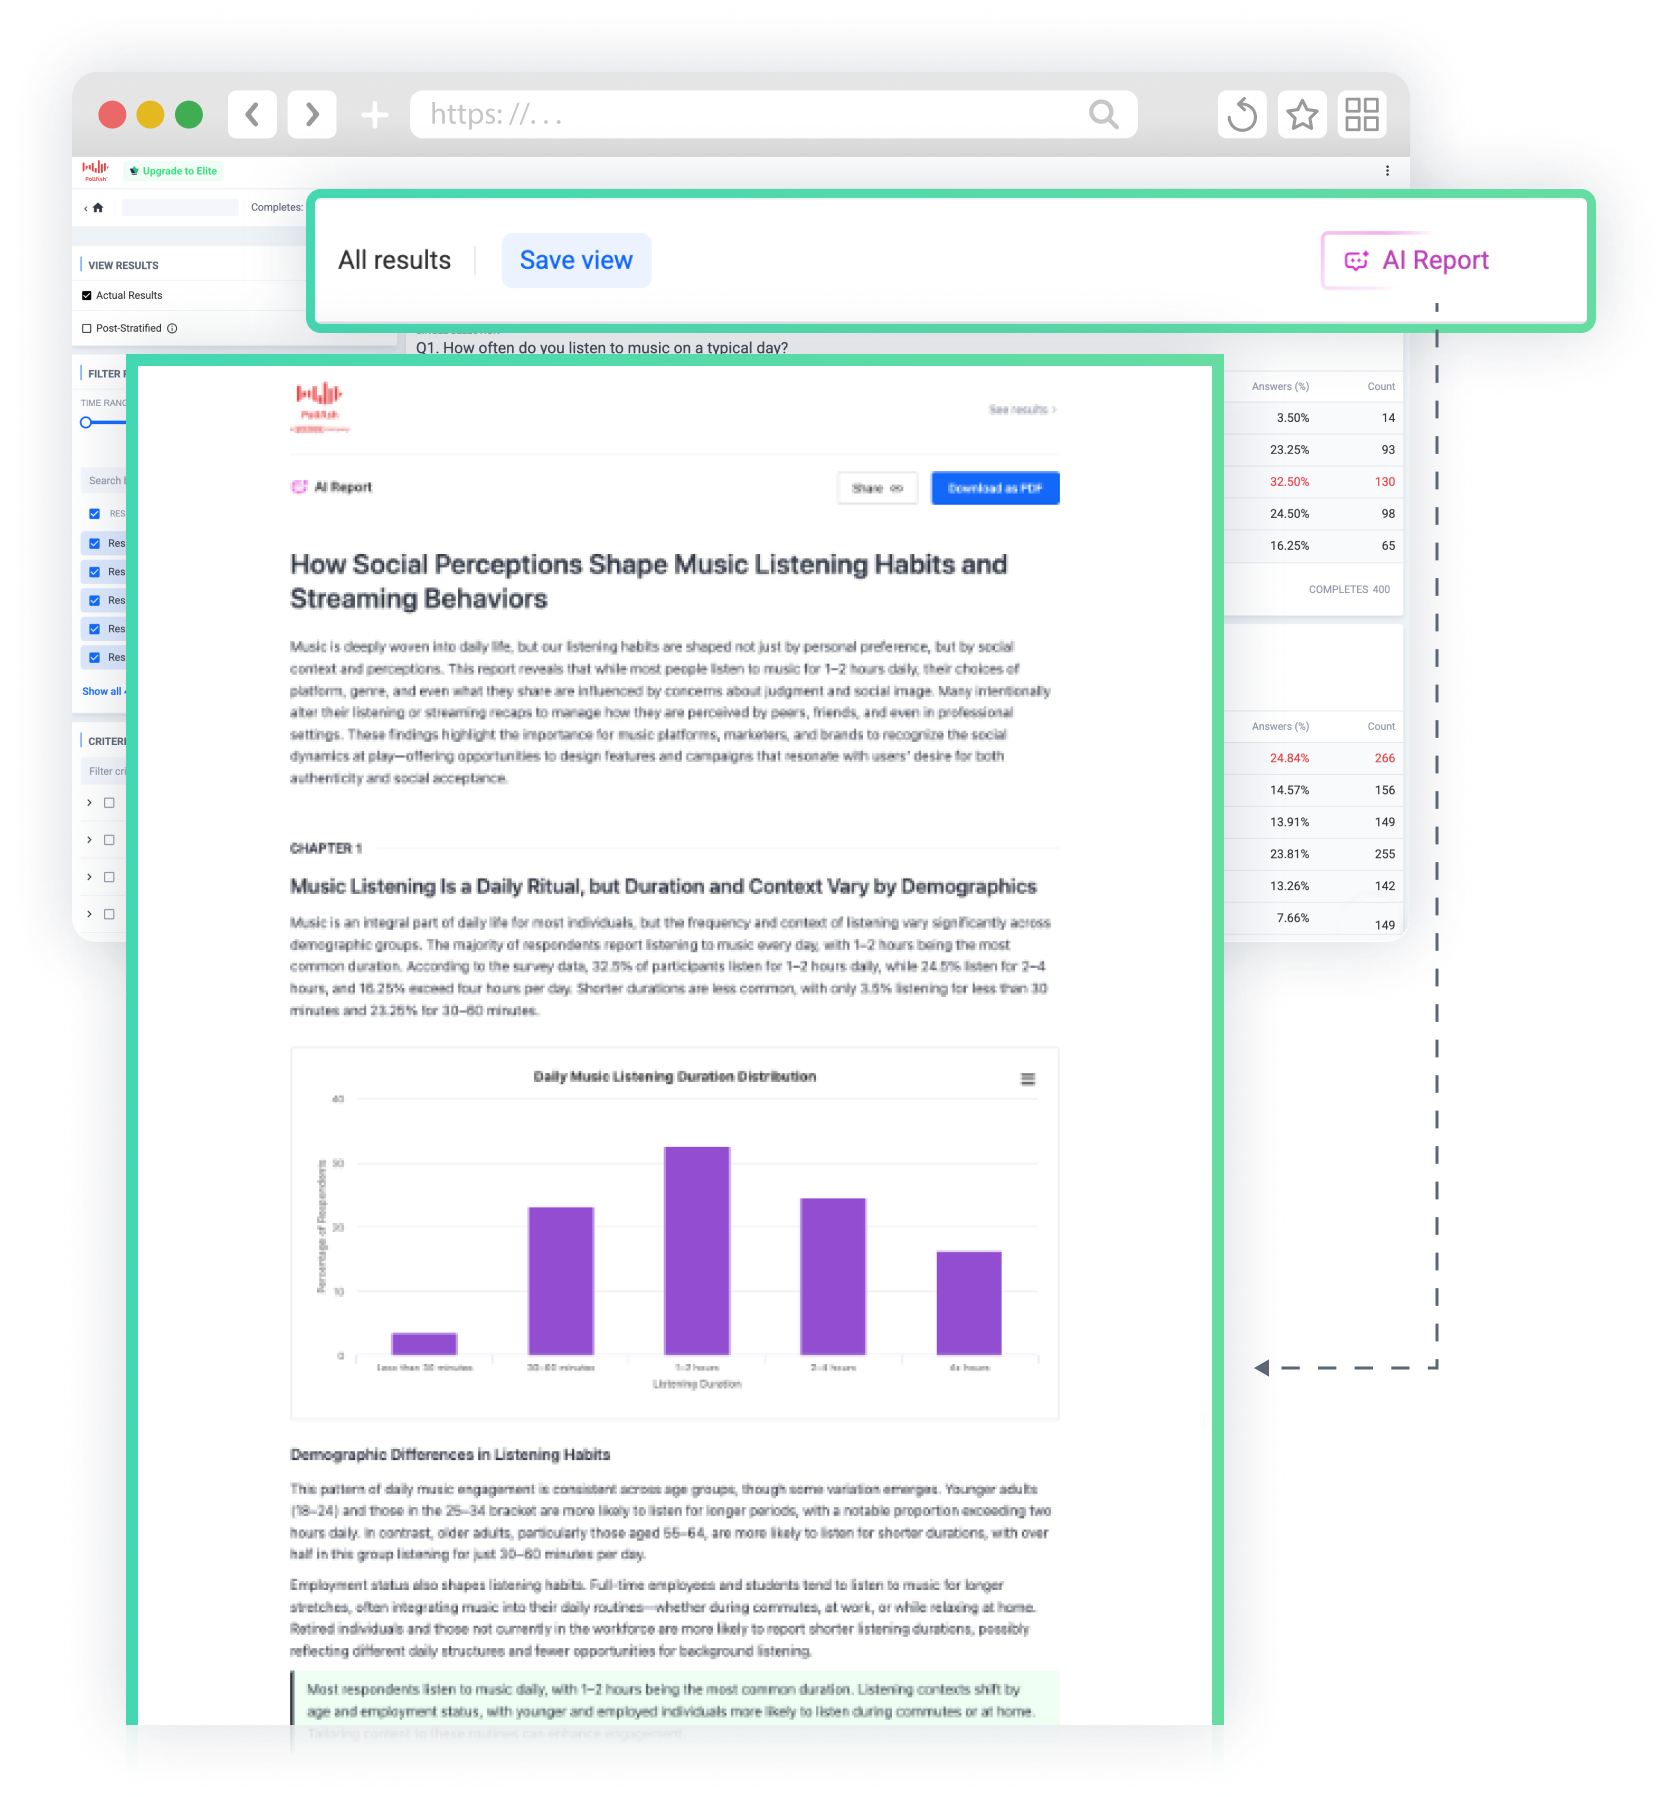
Pollfish’s AI Reports feature supports many survey types and significantly cuts the time it takes to analyze your results. MaxDiff analysis isn’t available yet, but it’s coming soon!
Our AI understands your questionnaire context, runs statistical tests, and codes open-ended responses automatically.
With one click, you can generate:
- An executive summary for stakeholders
- An in-depth report with charts, statistical evidence, and key takeaways
See it in action — explore a sample AI report.
Additional Benefits of Pollfish, Backed by Customer Quotes
In addition to Pollfish’s powerful MaxDiff analysis features, we offer a number of other advantages.
Rigorous Data Quality Measures
Unlike MaxDiff analysis tools that rely on external third-party audience panels, Pollfish operates its own first-party respondent communities (through our parent company, Prodege). This gives us complete control over how respondents are recruited, vetted, and managed, so you never have to wonder about the quality of your data.
To learn more about our approach to data quality, see our article on the 3 Survey Data Quality Issues Sabotaging Your Research (& How We Fix Them).
As several customers shared on Trustpilot:
“The most important point to make is that I trust the responses of my survey. My target audience was very specific and I could tell that the responses were legitimately coming [from] subjects in my target audience.”
– Read the full review here
“Each time I use this service I am blown away by the speed with which the responses come in and with the detail which most of them include. You can tell that the respondents take this very seriously. They must really enjoy doing it.”
– Read the full review here
Transparent Pay-per-Response Pricing

We offer a transparent, pay-per-response pricing model starting at $0.95 per response. Unlike competitors who charge hefty subscriptions or hidden fees, our pricing calculator shows you exactly how much you’re going to pay upfront. Just toggle the MaxDiff option within the calculator to preview your price without even signing up for the platform.
As several customers shared on Trustpilot:
“They charge based on the completed response. It is very fair and transparent. As a researcher, I have used many survey platforms, but they are the best so far.”
– Read the full review here
“The dollar amount they quote you in their cost calculator tool, and the number they show when you’re developing the survey, is the number you pay. I was burned multiple times by [competitor] charging me unexpected amounts and making it difficult to quit an expensive subscription. I’m so happy to have found Pollfish as an alternative. Their support team also responds VERY quickly to chat messages and has been tremendously helpful the few times I had questions.”
– Read the full review here
“The pricing is clear and transparent from the beginning. The results come quickly and can be downloaded in different formats and with different filters. What we like most is the ability to filter the results and analyze them separately for each segment. We highly recommend this platform.”
– Read the full review here
Fast Turnaround Time
Pollfish stands out for our industry-leading survey turnaround time. Results typically arrive in a few hours for general populations (e.g., U.S. adults 18+) or a few days for niche audiences (e.g., primary household grocery shoppers who regularly buy premium organic beverages).
Review for a general population survey:
“I needed a 25 question survey answered, and was able to get 500 completed surveys in 8 hours with Pollfish. The presentation of the results is very impressive and the demographics information Pollfish provided is invaluable.”
– Read the full review here
Review for a specialized niche:
“I’m amazed at how quickly the platform was able to deliver rich, segmentable data from over 500 respondents. I had feature-ready insights in only 3 days.”
– Read the full review here
Complimentary Support from Seasoned Market Researchers
Pollfish support goes beyond basic platform questions. Our team can help with strategic decisions around MaxDiff survey design, audience selection, and data analysis. And we’re available 24/7 via chat or phone.
As some of our customers mentioned on Trustpilot:
“The customer service team is super responsive too for those more complex enquiries about the tool and criteria. All in all this experience has been way easier (and cheaper) than any other ‘big players’ out there.”
– Read the full review here
“I love this product. I feel like it gives me enterprise grade market survey tech at a consumer price. Highly recommend. I love how responsive the customer support team is.”
– Read the full review here
“The customer service I received was fantastic. Brilliant guidance that helped get high-quality results. I was really pleased with the outcome and highly recommend using them.”
– Read the full review here
Intuitive and Easy to Use
Launching MaxDiff surveys with Pollfish is a breeze, whether you build a survey from scratch or opt to use our pre-built templates or AI survey builder.
As several of our customers noted:
“Pollfish is probably the single easiest software I’ve ever used. The drag and drop builder is great itself, but the template library also has anything we ever need, so you rarely have to design anything from scratch. The templates are also designed very well, we usually pick one, do a couple edits, and deploy. The whole thing takes less than 10 minutes.”
– Read the full review here
“The surveys were easy to set up, allowed me to select my very specific target and launched right away. Within a couple of days I had my results in an easy to interpret, actionable format well within my budget.”
– Read the full review here
“I have used this platform ~10x over time and find the process easy, their review process helpful, and the insights I get from people valuable as I work through different product concepts in market research. Their pricing is more reasonable than other competitors I’ve looked into, and am happily going to continue using Pollfish.”
– Read the full review here
End-to-End Market Research Services (and Flexible Support with Specific Areas)
If you prefer to hand off your MaxDiff project entirely, you can opt for our full-service option, fulfilled by our parent company, Prodege. Our team of seasoned market researchers will manage the entire project for you, including:
- Research design
- Survey programming
- Sample & fielding
- Data processing & analysis
- Reporting
Or, get help in just the areas where you need specialized expertise or would rather focus your time elsewhere.
Below, we’ll take a look at some of the benefits of our end-to-end MaxDiff analysis service option.
Note: For a deeper look into our full-service offering, read this article.
❇️ Decades of Collective Market Research Expertise
Prodege’s consulting team comprises experts with 20+ years of experience in market research. Our researchers come from leading firms, including Hall & Partners, Ipsos, Nielsen, Lieberman Research, NPD, and Kantar, bringing industry-leading best practices to every project.
❇️ Stellar White-Glove Service
We consistently hear from clients that our service stands out. At industry conferences, people regularly stop us to comment on how responsive and supportive our team is. One client even asked if we have a policy requiring responses within an hour — that’s how quickly we communicate. This level of responsiveness is central to how we work with every client.
Learn More About Our MaxDiff Analysis Offerings
You have two flexible options:
- Create a free account: Explore our platform and start building MaxDiff analysis surveys at your own pace — no credit card required.
- Inquire about our full-service market research offering, fulfilled through our parent company, Prodege.
2. Qualtrics
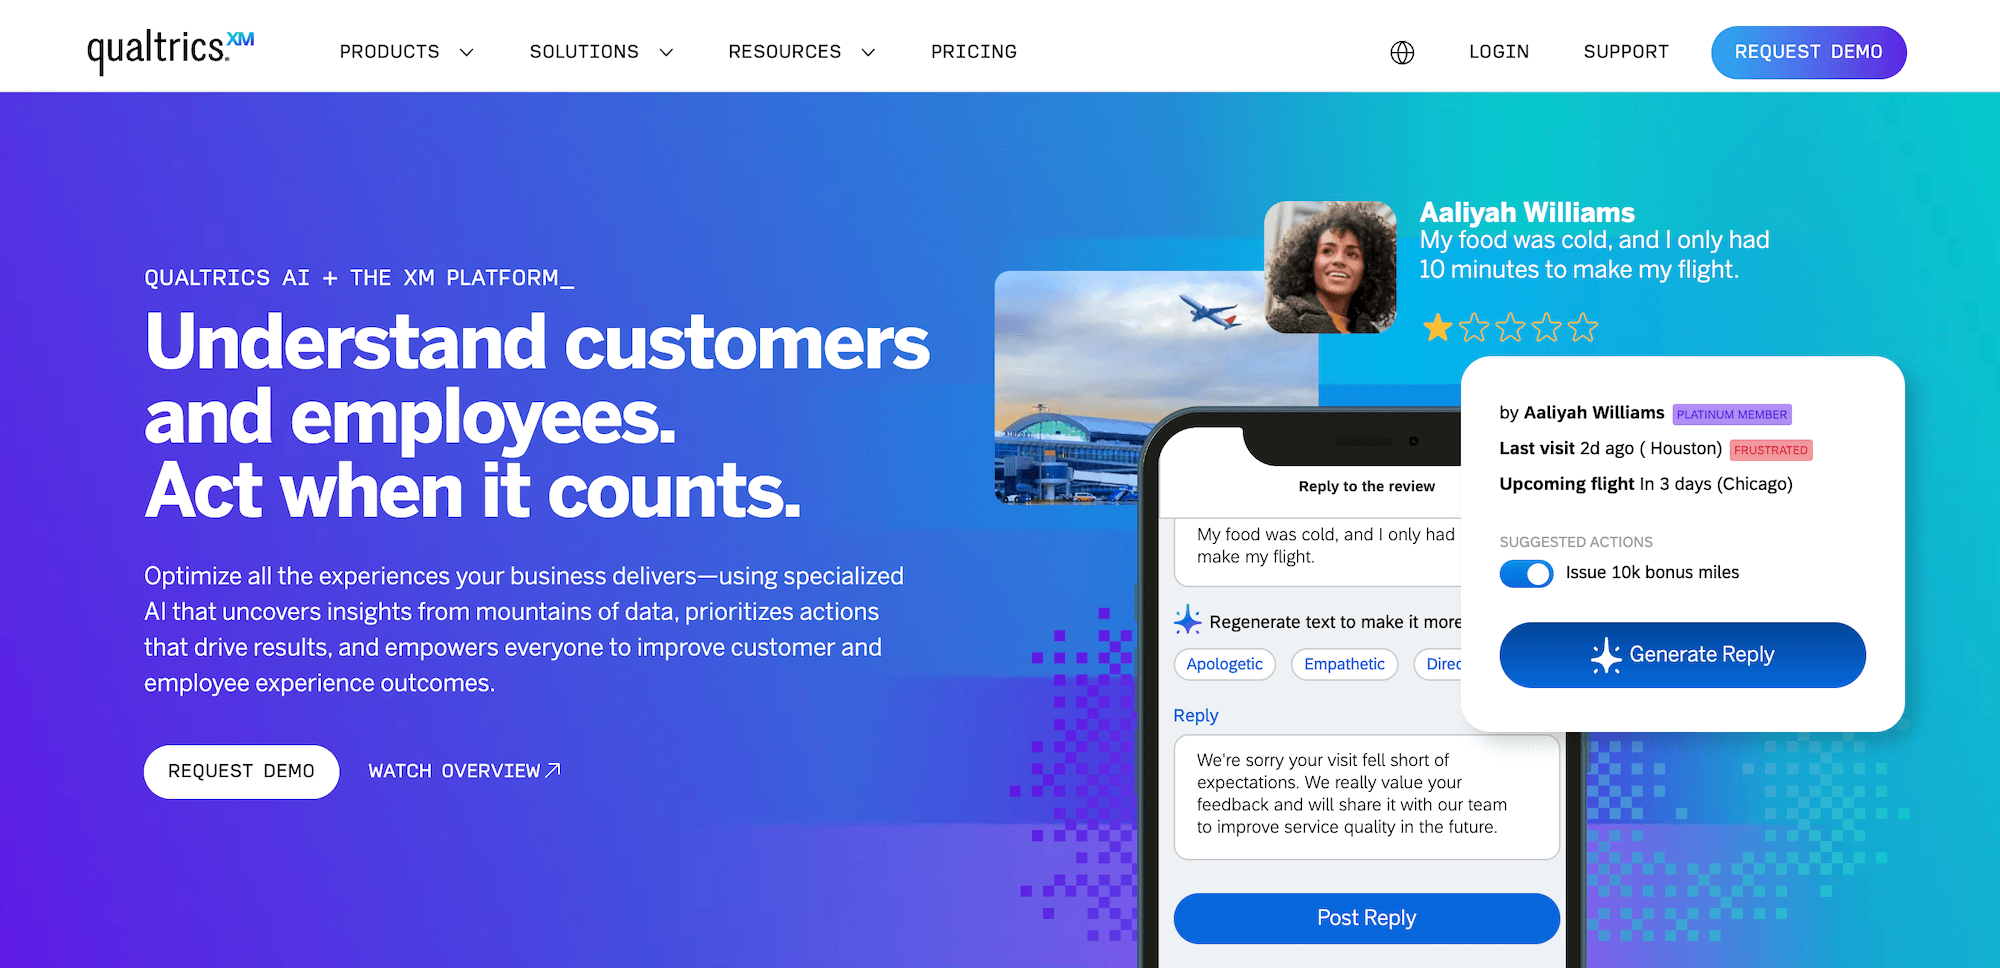
Qualtrics is an Experience Management (XM) platform that offers customer, employee, brand, and market research. MaxDiff is only available on the premium version of Qualtrics, which may be cost-prohibitive for some teams.
Some of their key features and capabilities for MaxDiff include:
- Ratio-scaled preference scores: MaxDiff results are reported on a ratio scale that allows researchers to compare the relative strength of preferences across items.
- Efficient experimental design: The platform applies statistically efficient designs to ensure balanced item exposure.
- Segmentation and subgroup analysis: MaxDiff results can be analyzed across segments to understand how preferences differ by audience, behavior, or demographics.
- Integration with broader research workflows: MaxDiff studies can be combined with other Qualtrics research tools to connect preference insights to experience, brand, or product decisions.
Note: To learn how Pollfish compares to Qualtrics, see this article.
3. SurveyMonkey
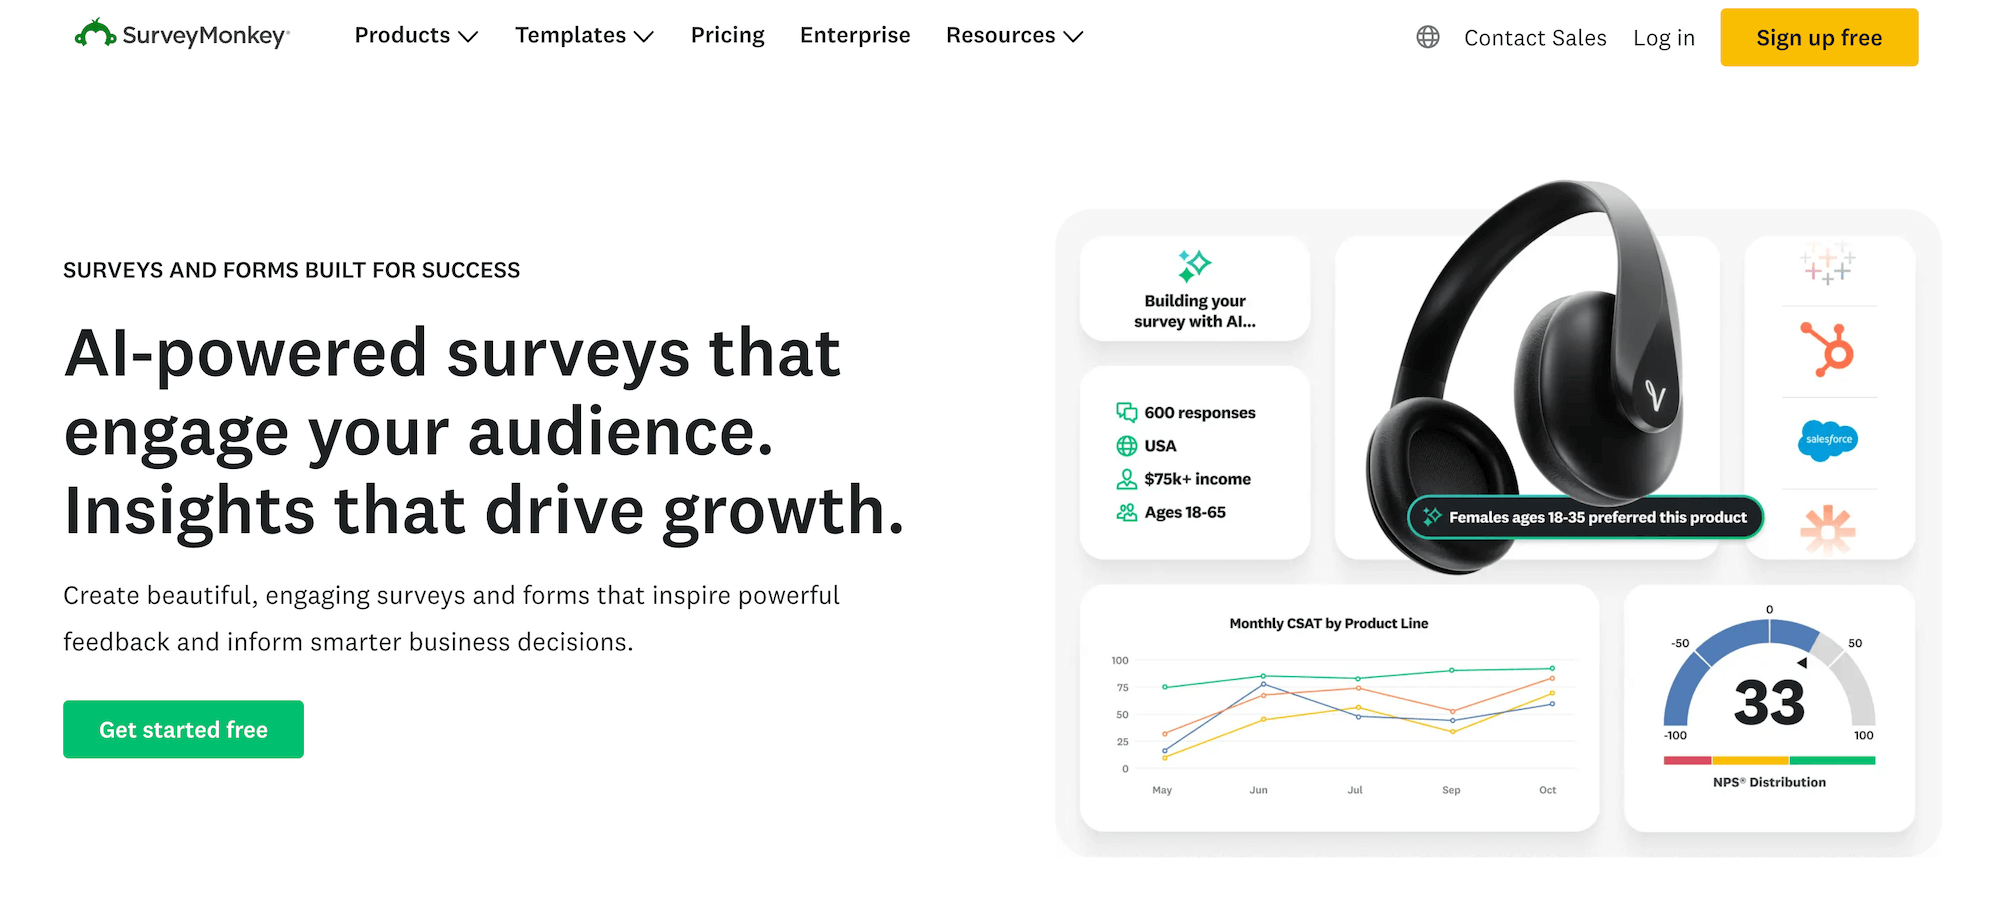
SurveyMonkey is an online survey platform that offers a MaxDiff tool.
Some of their key features and capabilities for MaxDiff analysis include:
- Intuitive setup: Automatically builds experimental MaxDiff questions for you based on the list of items you enter.
- Global audience targeting: Integration with SurveyMonkey Audience lets you target and collect responses from specific demographic or professional groups worldwide.
- Customizable survey distribution: You can send your MaxDiff survey via web links, email, or social channels to reach your intended respondents.
Note: To learn how Pollfish compares to SurveyMonkey, see this article.
4. OpinionX
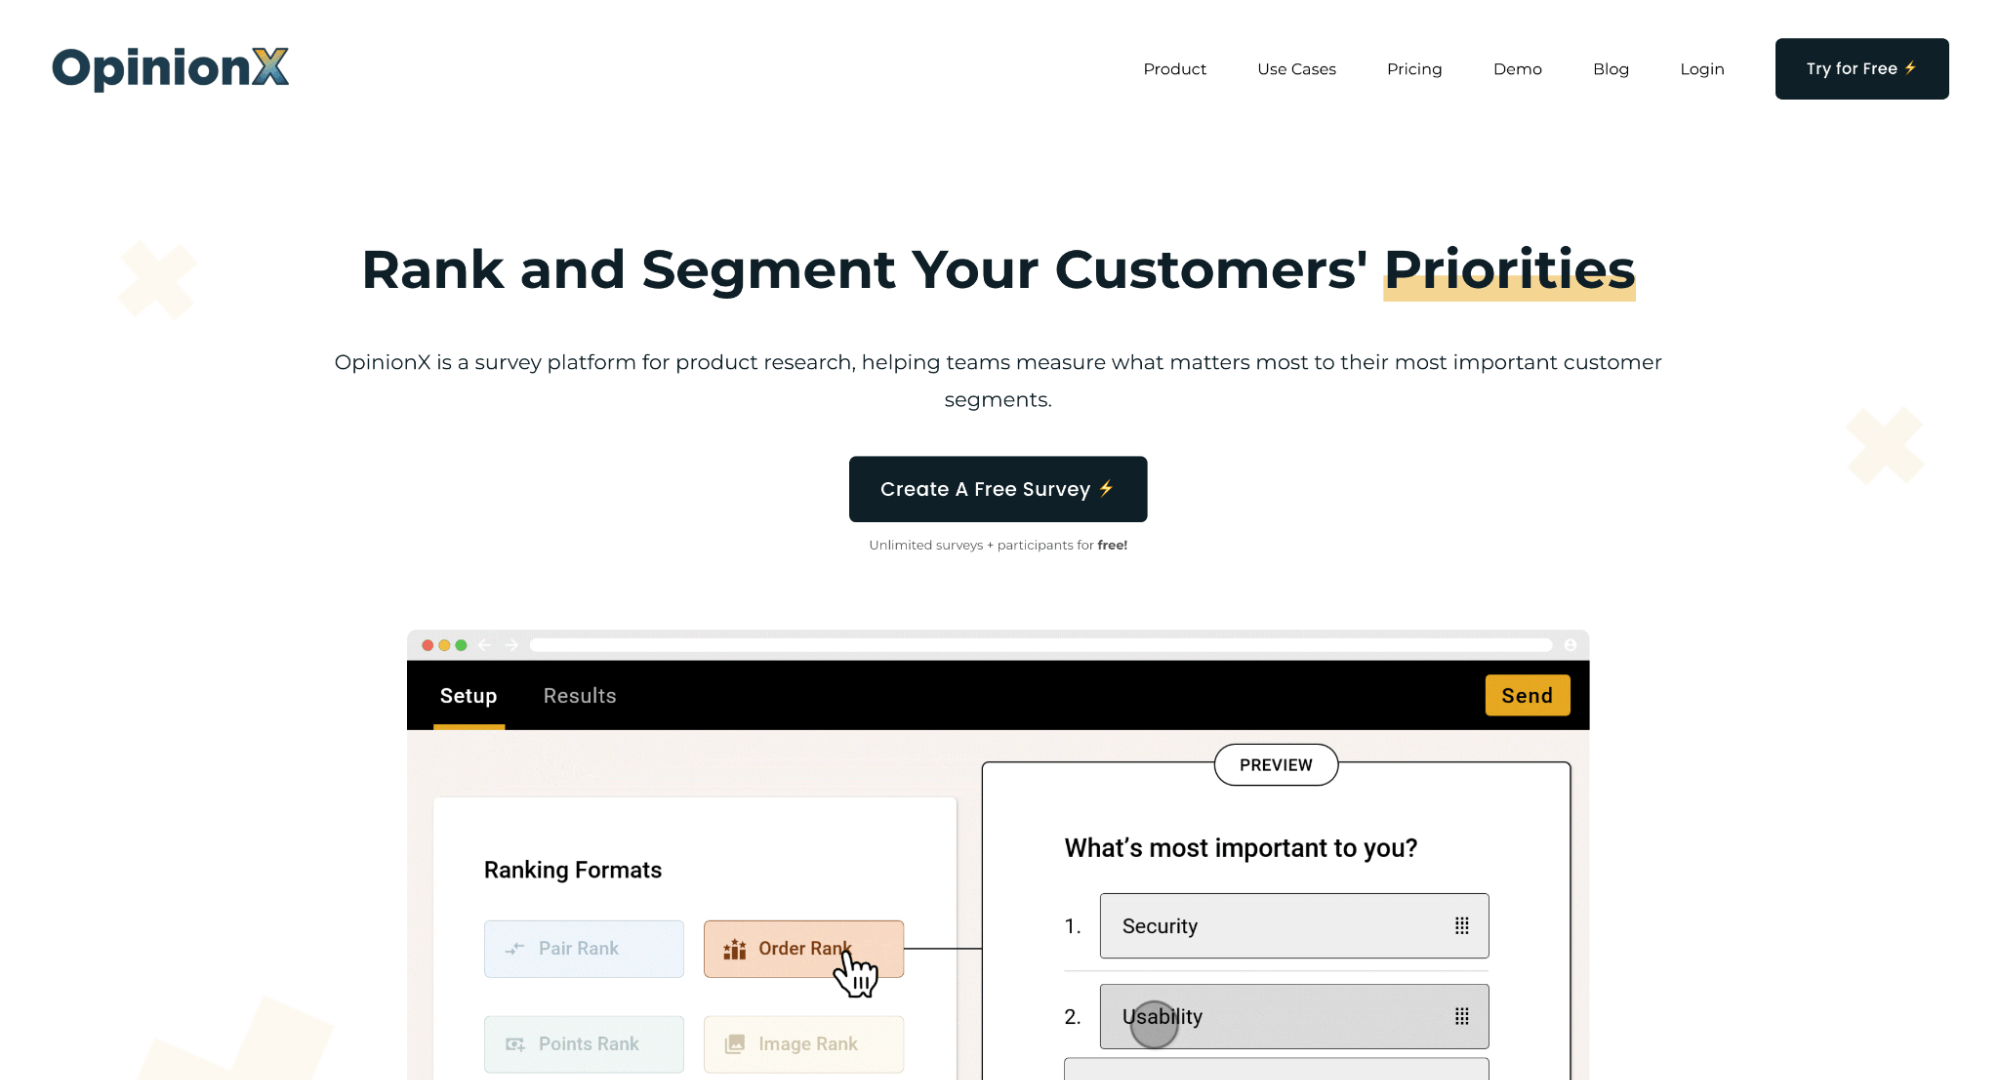
OpinionX is an online research tool that lets you run MaxDiff surveys.
Some of their key features and capabilities for MaxDiff include:
- Segment comparison with one-click recalculation: You can instantly recalculate ranked results to see how priorities differ between different respondent subgroups.
- Participant filtering: You can filter your respondents to isolate ideal subgroups for deeper analysis or follow-up research.
- Built-in learning resources: The site includes guides and tutorials on MaxDiff and other ranking methods to help users understand how to design and interpret studies.
Overall, it’s a solid tool to glean MaxDiff data via advanced research methods.
5. Sawtooth Software
Sawtooth Software is a market research software offering MaxDiff analysis.
Some of their key features and capabilities for MaxDiff include:
- Ratio-scaled output: MaxDiff Analysis produces scores on a ratio scale that sum to 100 across items, enabling interpretation of relative differences in preference.
- Empirical Bayes estimation: Individual-level scores can be estimated using empirical Bayes techniques.
- Segmentation and subgroup comparison: Analysts can segment respondents and compare MaxDiff scores across key groups.
- Exportable design and data: MaxDiff designs and response data can be exported for further analysis.
Overall, it’s a solid tool for utilizing the best-worst scaling model. They offer functionality to help you better analyze different customer segments.
6. Q Research Software
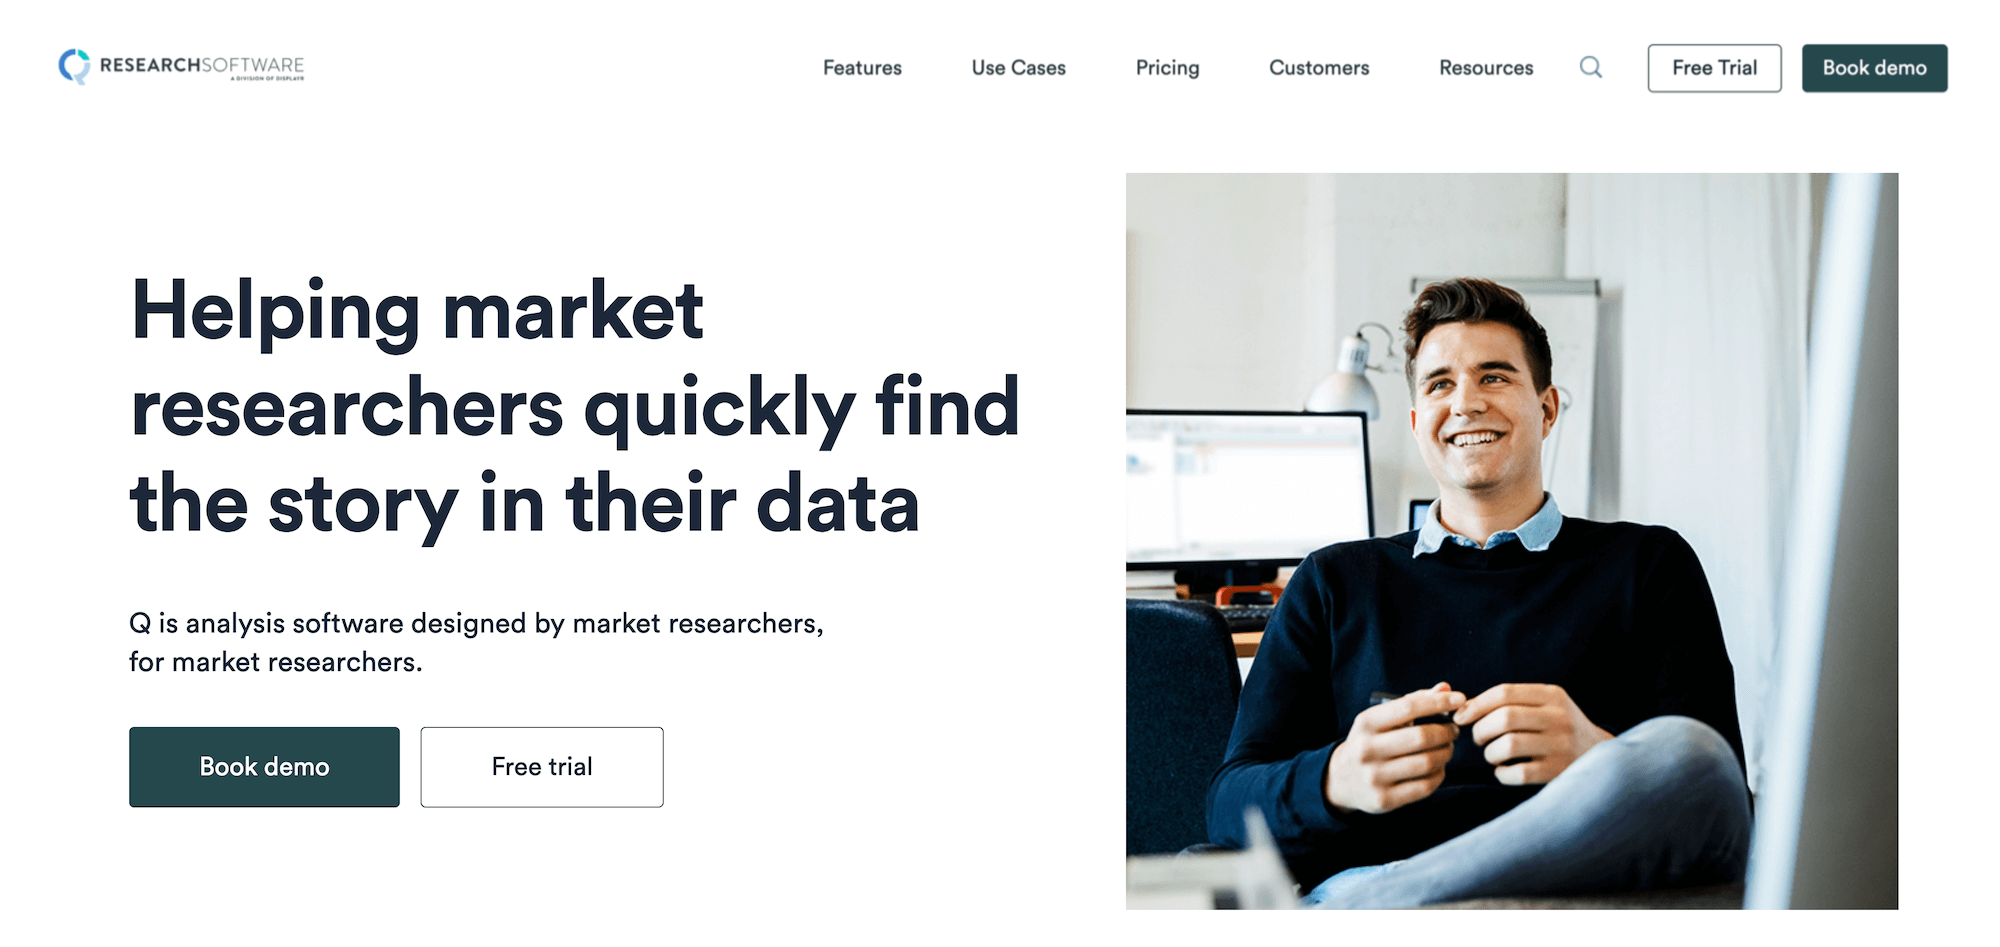
Q Research Software offers market research analysis and reporting, including MaxDiff.
Some of their key features and capabilities for MaxDiff analysis include:
- Experimental design generator: Tools to build and check efficient MaxDiff experimental designs tailored to the number of alternatives and tasks.
- Multiple MaxDiff analysis options: Supports legacy ranking analyses as well as modern approaches, including utility and preference share computation.
- Hierarchical Bayes estimation: Supports advanced MaxDiff modeling using Hierarchical Bayes.
- Latent class segmentation: Identify distinct preference segments in your audience.
- Covariate integration: Include respondent covariates to improve the accuracy and relevance of MaxDiff models.
Overall, it’s a solid MaxDiff research tool for improving decision-making, and they also offer other use cases.
7. Conjointly

Conjointly is a survey research platform that offers MaxDiff analysis.
Some of their key features and capabilities for MaxDiff analysis include:
- Brand-specific MaxDiff combinations: You can design MaxDiff tests that account for distinct brand contexts by combining Brand-Specific Conjoint with MaxDiff for tailored analysis.
- Feature Placement Matrix integration: Conjointly can generate a matrix that positions features by both preference and willingness-to-pay when combined with compatible analyses like Van Westendorp.
- Simulation of preference shares: The tool can simulate preference share outcomes based on MaxDiff scoring, providing indicative results for decision scenarios.
- Multilingual and randomization features: Includes multilingual support and randomization blocks.
Overall, it’s a solid tool to optimize business outcomes, discover the best product features, and get clarity on prioritization.
Start Using Pollfish for MaxDiff Analysis
We invite you to:
- Create a free account (no credit card required).
- Inquire about our full-service offering, fulfilled through our parent company, Prodege.
You may also be interested in: