Conjoint Analysis: What It Is, Use Cases, Examples & More

A common challenge in market research is that customers are not always able to identify or articulate their real purchase decision drivers clearly.
One solution to this is conjoint analysis, a powerful methodology designed to uncover the hidden drivers of consumer behavior. By revealing the trade-offs customers are willing to make, conjoint analysis helps you move from making decisions based on assumptions to making decisions based on data.
Based on our experience helping companies use conjoint analysis, both through our full-service offering (via our parent company Prodege) and Pollfish, our DIY market research tool, we’ve heard commonly repeated questions. This guide centralizes these questions and our answers.
Table of Contents
- What is conjoint analysis?
- Common use cases and applications of conjoint analysis
- Types of conjoint analysis
- An example of conjoint analysis
- Our conjoint analysis offerings: full-service vs. DIY options
- How to run a conjoint analysis with Pollfish, our DIY survey platform
- How to analyze conjoint analysis results within Pollfish
What Is Conjoint Analysis?
At its core, conjoint analysis is a research technique that uncovers what people want by asking them to make choices, just like they do when shopping. The process is built on three simple premises:
- Any product is a bundle of features
- Each feature has a certain appeal (called ‘utility’)
- We can predict choices by adding up the utility of each feature
Conjoint-analysis is more representative of real-world purchase behavior, asking respondents to choose between scenarios by making trade-offs between attributes.
The process works in three steps:
1. Breaking down the product
The first step of conjoint analysis is to deconstruct the product or service into core components called attributes (features like brand, price, or color).
Each attribute has specific options called levels (for example, the color attribute might have levels of white, silver, and gold).
2. Present realistic choices
Next, conjoint analysis shows respondents a series of product concepts, each with a different combination of levels. Respondents are asked which product they would most likely buy from each set.
Rather than rating features in isolation, this forces real trade-off decisions that simulate actual purchasing behavior.
3. Calculate what matters most
The last step of conjoint analysis is analyzing thousands of choices across many respondents to calculate the utility of each feature level. This reveals a numerical utility score for every option, showing precisely which features drive consumer preference and which are most influential in decision-making.
Common Use Cases and Applications of Conjoint Analysis
Below are some of the most common use cases for conjoint analysis.
✅ Fine-tuning features for new product launches
Conjoint analysis systematically tests different feature combinations to identify the optimal product configuration that resonates most with your target market, eliminating guesswork from product development decisions.
✅ Pricing optimization
By including price as an attribute, conjoint analysis reveals how customers weigh price against other features and quantifies price elasticity, identifying optimal price points that maximize revenue or market share.
✅ Product line optimization
Conjoint analysis can determine whether new combinations of existing features would be more appealing to the market, helping you optimize current offerings for maximum impact.
✅ Competitive differentiation
Conjoint analysis can be used to uncover the hidden drivers of consumer choice that aren’t apparent in traditional research, allowing you to develop different product strategies that directly address the market’s most important needs.
✅ Brand valuation
Conjoint analysis quantifies your brand premium by calculating the specific dollar amount customers are willing to pay for your brand versus competitors.
✅ Understanding customer preferences
Unlike simple rating surveys, conjoint analysis forces realistic trade-offs and measures preferences at an individual level, uncovering the psychological drivers behind purchasing decisions.
Types of Conjoint Analysis
The two most common types of conjoint analysis are:
✅ Choice-Based Conjoint Analysis (CBC)
Choice-based conjoint analysis (CBC), also known as discrete-choice conjoint analysis, is the most widely used conjoint analysis method.
It simulates real-world purchasing by asking respondents to choose between product combinations. This straightforward approach effectively captures preferences across multiple product features, making it highly applicable to diverse market research needs.
✅ Adaptive Conjoint Analysis (ACA)
Adaptive Conjoint Analysis (ACA) customizes the survey experience for each respondent based on their previous answers. This adaptive approach is particularly useful for studies with many features or attributes, as it streamlines the process while maximizing the quality of conjoint data collected from each participant.
Some other less common types of conjoint analysis include:
- Menu-based conjoint analysis
- Two-attribute tradeoff analysis
- Full-profile conjoint analysis
- Self-explicated conjoint analysis
- Max-diff conjoint analysis
- Hierarchical Bayes analysis (HB)
An Example of Conjoint Analysis
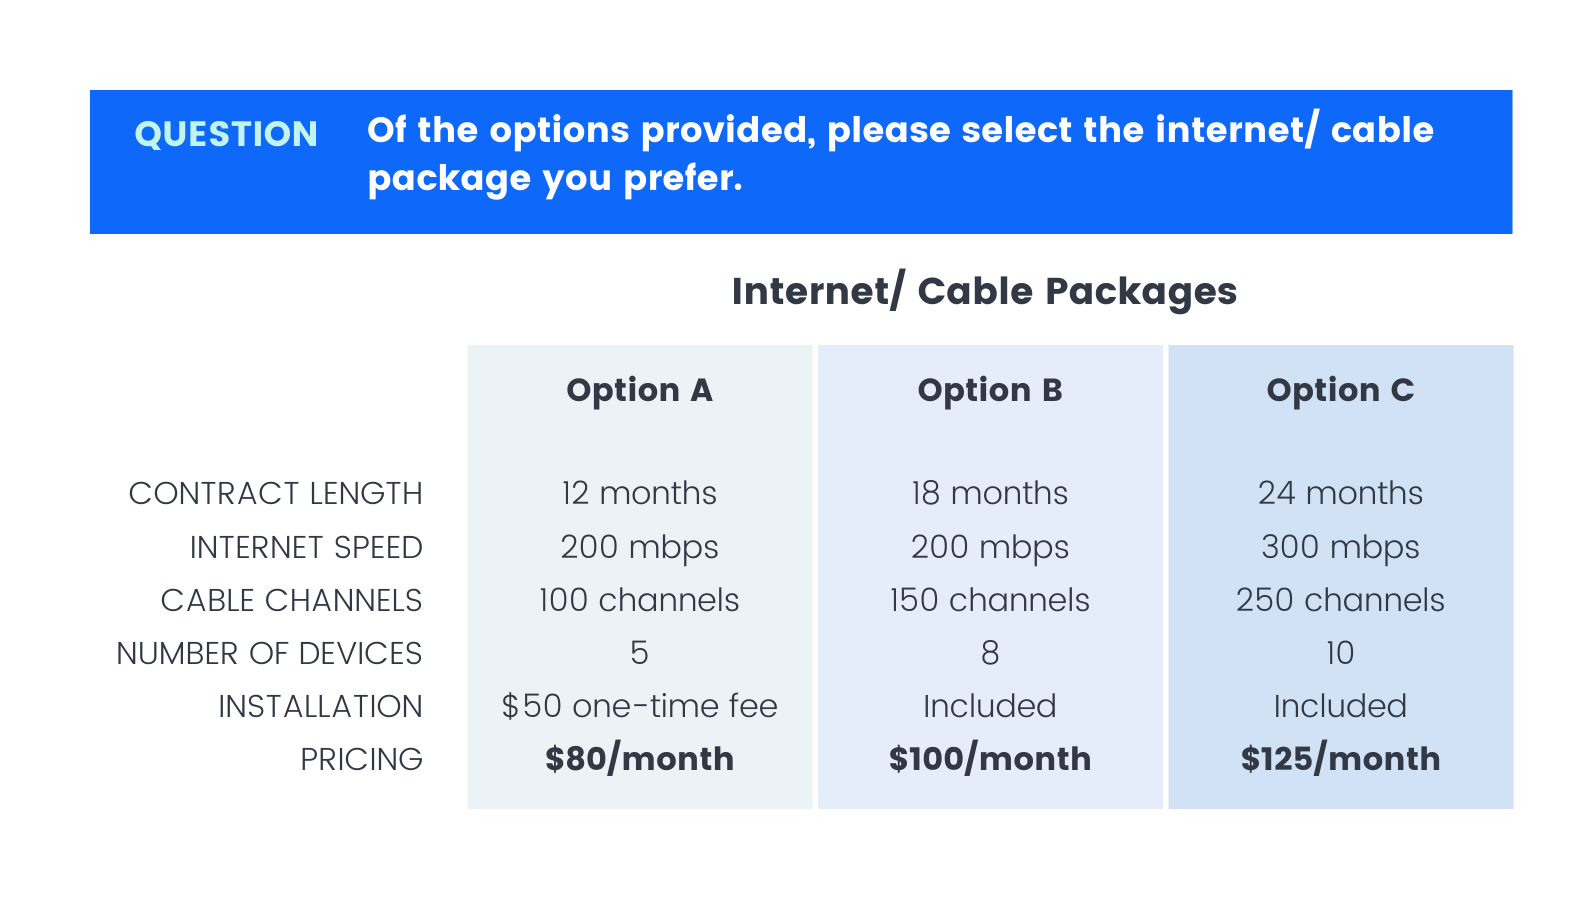
Let’s take a look at a conjoint analysis example: a Choice-Based Conjoint (CBC) analysis that explores consumer preferences for gym membership options.

This conjoint analysis evaluates 4 key attributes:
- Contract Length
- Access Hours
- Additional amenities
- Monthly Fee
Each attribute has distinct levels that represent different offerings a gym might provide. For example, the levels associated with the contract length attribute are 12 months, 1 month, and 6 months.
Respondents are shown three gym membership options (Option 1, 2, and 3), each with a unique combination of attributes. By asking participants to select their preferred option, the analysis aims to uncover which features are most valued by potential gym members.
Our Conjoint Analysis Offerings: Full-Service vs. Our DIY Platform
We offer two distinct ways for clients to conduct conjoint analysis, each suited for different needs and budgets.
Option 1: Full-Service Conjoint Analysis
Through our parent company Prodege, we offer a full-service, done-for-you conjoint analysis option. It’s ideal if you want to free up your time or tap into specialized expertise.
Our team brings decades of market research experience, with many members coming from firms like Hall & Partners, Ipsos, Kantar, Lieberman Research, Nielsen, and NPD.
We’ll start the process with a call to understand your exact goals and needs. Some of the most common deliverables preferred by our clients include:
- The Market Simulator: This is one of the most unique and powerful aspects of conjoint analysis. It’s an interactive tool that allows you to “predict” consumer choice for products that may not even exist yet. It provides clear, quantitative answers to questions like: “What will happen to our market share if we increase our price by 5%?”
- The “Ideal Product” Profile: Get a clear blueprint for building the product or service the market wants. It ranks all possible product configurations by their total appeal (utility), telling you exactly what combination of features and price will be most successful. This insight effectively removes the guesswork from product development.
Prodege is renowned for our commitment to data quality. We even have an in-house, 40-person Panel Support, Security, and Compliance Department dedicated to ensuring the quality and integrity of survey data. To read more about our data quality measures, read this article on the 3 Survey Data Quality Issues Sabotaging Your Research (& How We Fix Them).
Option 2: DIY Survey Platform
Another option is to run your conjoint analysis through Pollfish, our DIY survey platform, renowned for:
- Exceptional survey data quality: We own and nurture our first-party respondent communities through our parent company Prodege, implementing rigorous verification and anti-fraud processes so you can feel confident making decisions based on survey results.
- Transparent, pay-per-response pricing: We offer pay-as-you-go pricing so you pay only for the responses you need, with no hidden fees or monthly subscriptions.
- Fast turnaround time: Working with our own first-party audiences means our surveys complete much faster than competitors’ — just a few hours for general audiences (e.g., 18+ US adults) or a few days or longer for more niche audiences (e.g., Gen Z vegetarians who live in New York).
- Complimentary 24/7 support from seasoned market researchers: Our team of experienced market researchers is available at any time to answer your questions, completely free of charge. Beyond just basic technical support, we can answer specific questions about how to best set up & analyze your conjoint analysis study.
In the next sections, we’ll dive deeper into exactly how to run and analyze a conjoint analysis study with Pollfish.
How to Run a Conjoint Analysis with Pollfish, Our DIY Survey Platform
Below is a brief overview of how you can create a conjoint survey with Pollfish.
For a more in-depth explanation of each step, see this article.
❇️ Step 1: Open the Pollfish dashboard and hit “Create a new survey”
❇️ Step 2: Add the conjoint method to your survey

Select the Conjoint option from the question type options.
❇️ Step 3: Add the instructions

Provide instructions explaining how to answer the question. Conjoint presents multiple rounds of product options where respondents select their preferred choice each time.
❇️ Step 4: Add product attributes and levels
Attributes are product characteristics like shape, type, or quantity.
- Attributes can be categorized as Features by default.
- For price attributes, select the “Price” type to enable the Willingness to Pay graph.
- Price attribute guidelines: Avoid zero values, and use roughly equal intervals between levels (e.g., $10, $15, $20)
Levels are the possible values for each attribute.
- Example: A “scent” attribute might have levels of floral, citrus, or lavender.
- Product alternatives are created by combining different levels across all attributes.

Price formatting: Enter prices with currency symbols (e.g., “$15”) for display in the survey, while the plain numbers in “Just the number” fields are used for analysis.
❇️ Step 5: Heed the following restrictions and advice on attributes and levels
- Typically, 5 to 7 different attributes are considered optimal. This range strikes a balance between providing enough detail to capture consumer preferences and keeping the survey manageable for respondents.
- Each attribute should ideally have 2 to 5 levels and no more than 7.
❇️ Step 6: Prohibit particular level pairs

By default, all attribute levels can appear together, which may create unrealistic product combinations, like a product with premium features at the lowest price.
Use the “Exclude Combinations” setting to prohibit unrealistic pairings. We recommend excluding no more than 4 combinations.
❇️ Step 7: Optionally enable “none of the above”
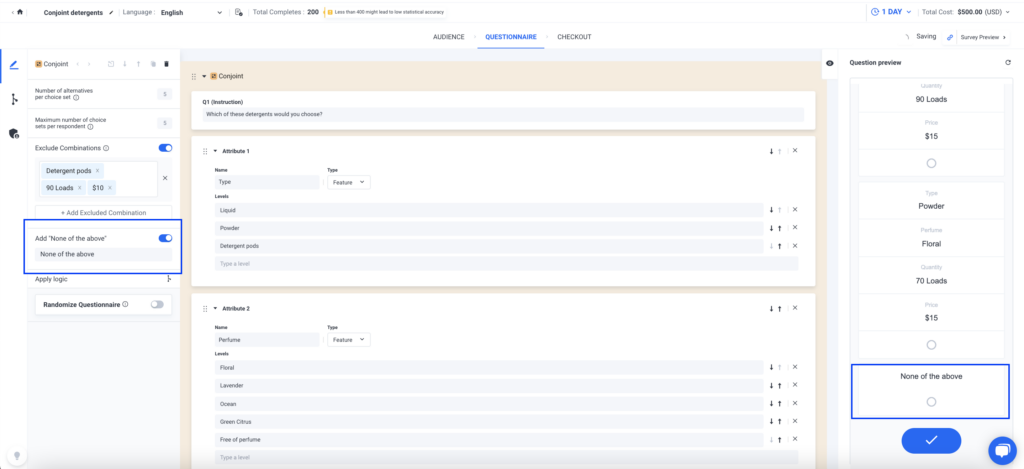
The “None of the Above” option is disabled by default. When enabled, it automatically appears as the last choice in every product set, eliminating the need to add it manually to each question and saving you time.
❇️ Step 8: Access the preview
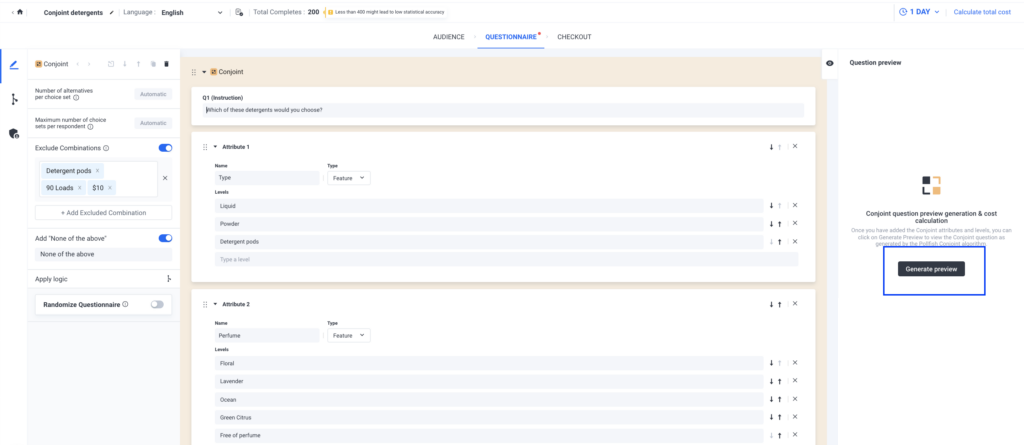
Click “Generate Preview” to see how your conjoint question will appear to respondents. The algorithm uses your attributes and levels to create realistic choice sets.
The preview includes:
- Your complete conjoint question with choice sets
- Any additional survey questions
- Updated total cost and survey length
- Number of alternatives and choice sets
Important: Regenerate the preview after changing attributes, levels, or exclusion rules to see updated costs and question design.
How to Analyze Conjoint Analysis Results Within Pollfish
Pollfish lets you create custom branded visualizations of your conjoint analysis results directly within the platform, saving time and eliminating the need for external tools like Excel.
A standout Pollfish functionality is the ability to export charts directly into PowerPoint with your brand colors automatically applied, eliminating hours of manual formatting. This capability is available through our Insights Builder feature for high-volume users.
Below are just a few examples of the charts you can generate to analyze conjoint analysis survey results. For more details on how to analyze conjoint analysis results in Pollfish, read this guide.
❇️ The Attribute Relative Importance Graph

This graph shows how much each attribute influences product choice. Higher percentages indicate greater influence on consumer decisions.
Note: This chart reflects only the specific attribute levels you included in your design.
❇️ Level Utilities

This shows which specific levels within each attribute drive customer choices. Each graph displays preference strength for an attribute’s levels. Higher percentages indicate a stronger influence on product selection.
❇️ Distribution of Level Preferences Graph

This graph shows the probability of each level being chosen if all other attributes remained constant. Higher percentages indicate a stronger preference among respondents.
❇️ Willingness to Pay

Willingness to Pay shows the maximum price customers will pay for specific product features — essentially, how much extra they’ll pay to upgrade from one level to another.
Each attribute has its own chart showing monetary values. Select different baseline levels to compare what respondents will pay for upgrades or downgrades.
Note: This chart is only available when your conjoint includes a Price-type attribute.
❇️ Ranked List of Product Alternatives
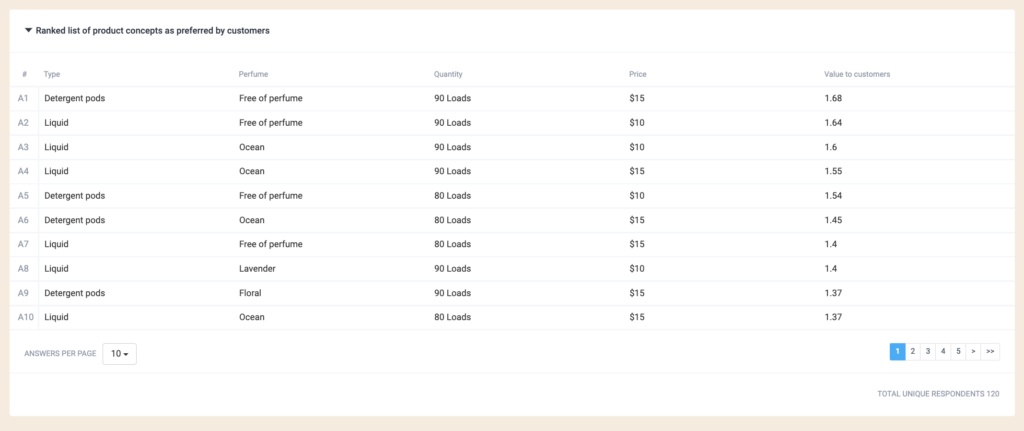
This table ranks product alternatives based on respondent preferences, with the most preferred options listed first.
Learn More About How We Can Help You Run Conjoint Analysis Studies
We invite you to:
- Create a free Pollfish account to explore our DIY survey tool.
- Book an introductory call to discuss our full-service offering, fulfilled through parent company Prodege.